
A reasonable external baseline for General European Strategic Investments (ticker: GESI) indicates a 2025 price envelope centered near $0.5296 with a published low of $0.1449 and high of $0.9143, while a 2026 base case interpolated from the same source’s 2025→2030 path is approximately $0.697 with an illustrative $0.191–$1.203 band derived via CAGR, subject to OTC micro-cap risks and potential dilution effects. These ranges are anchored to third-party forecast data and a transparent interpolation method using the source’s 2030 average target, not to internal financial guidance from the company, which remains limited in the public domain for a Pink market issuer.
Company snapshot
GESI is General European Strategic Investments Inc., a U.S. OTC-listed holding company with projects and interests in Europe spanning the Laakso PGE–Nickel–Copper project in Finland, a Transcarpathian gold portfolio in Ukraine, an 80% economic interest in a potential EuroGas arbitration award in Slovakia, and a 49% stake in UK waste management business ColdPro, indicating a diversified asset set with exploration and legal-claim exposure rather than established operating cash flows. Major news archives highlight project licensing activities in Finland, EU-funded exploration collaborations (SEEMS DEEP), and changes in leadership, underscoring an early-stage and special-situations profile rather than a mature producer with standardized financial reporting cadence. In August 2022 the issuer disclosed that OTC Markets placed a Caveat Emptor flag after detecting unauthorized promotional materials, a material risk context for valuation confidence and liquidity in the Pink market segment until robust disclosures and operations can improve investor certainty.
Price context: today versus range
A recent Morningstar snapshot shows a price of roughly $0.03 with a 52‑week range reported as $0.00–$0.08, illustrating extremely thin trading dynamics and wide percentage swings common in micro-caps at sub‑penny to low‑penny levels. This micro‑cap context implies price formation is highly sensitive to small absolute moves, spreads, and any corporate actions, which must be accounted for when translating scenario targets into realistic execution paths.

2025 external forecasts (late-year monthly view)
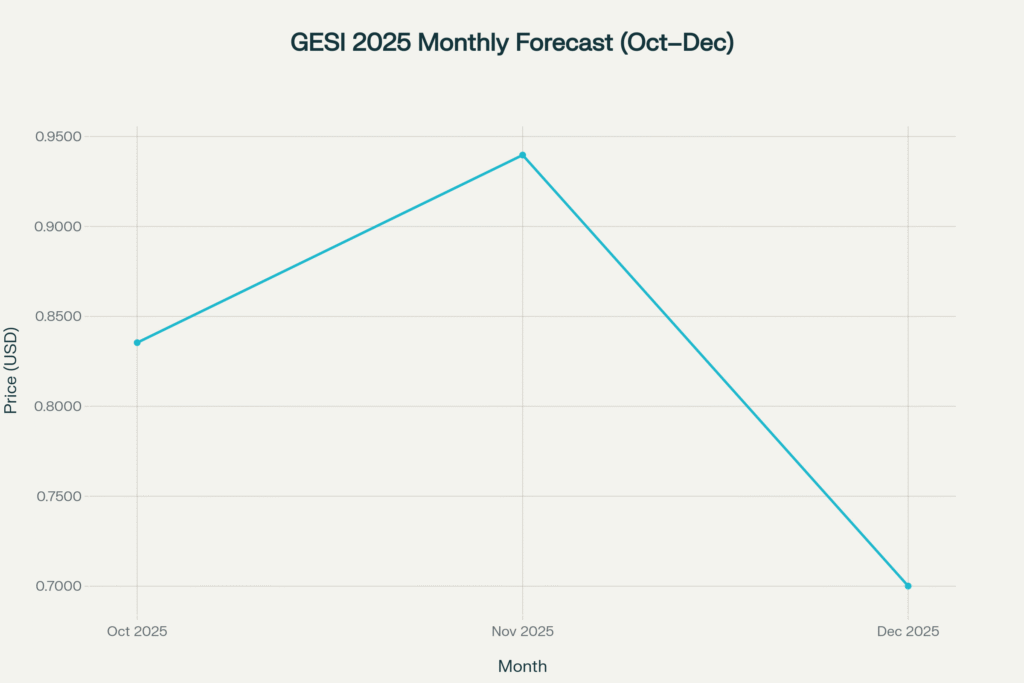
One third‑party forecast enumerates late‑2025 monthly averages around sub‑$1 levels despite today’s low‑penny spot, specifically October $0.8354, November $0.9397, and December $0.7001, which demonstrates the extremely wide dispersion in automated models for illiquid tickers. These monthly figures sit within the same provider’s 2025 annual scenario band (low $0.1449, base $0.5296, high $0.9143), reinforcing that monthly spikes and dips can be substantial in model outputs absent strong, consistent fundamentals.
2025 scenario targets (low/base/high)
The same external source aggregates annual 2025 scenarios at low $0.1449, base (average) $0.5296, and high $0.9143, equating to very large percentage gains from a recent snapshot price given the sub‑penny starting point and underscoring a speculative profile. Because issuer financials and liquidity are limited in the public domain, investors should treat these as directional bands rather than precise targets, especially as OTC Pink securities can undergo material corporate actions (e.g., raises, splits) that alter per‑share math.

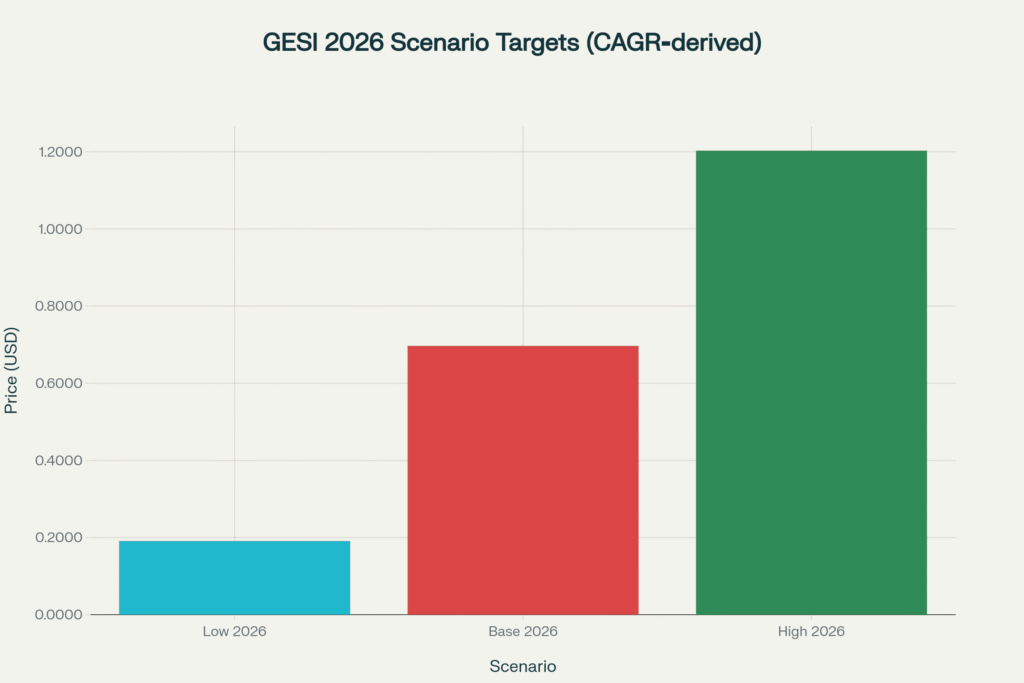
2026 interpolation via CAGR from the same source
To translate the 2025 external baseline into 2026, the 2030 average target from the same dataset (2.0873) can be combined with the 2025 base (0.5296) to compute an implied five‑year CAGR of approximately 31.6%, using CAGR = ( 2.0873 0.5296 ) 1 5 − 1 ≈ 31.6 % CAGR=( 0.5296 2.0873 ) 5 1 −1≈31.6% to derive a 2026 base of 0.5296 × 1.316 ≈ 0.697 0.5296×1.316≈0.697. Applying the same growth factor to the source’s 2025 low and high gives illustrative 2026 low 0.1449 × 1.316 ≈ 0.191 0.1449×1.316≈0.191 and 2026 high 0.9143 × 1.316 ≈ 1.203 0.9143×1.316≈1.203, transparently linking 2026 levels back to the same provider’s 2025 and 2030 assumptions without introducing unrelated data. These are mechanical interpolations to provide a consistent 2026 band, not a replacement for issuer guidance or a guarantee against capital structure changes common in this market tier.
Market cap implications (illustrative)
Using Morningstar’s snapshot market cap of about $8.85 million and price $0.03 implies roughly 295 million shares outstanding today via Shares ≈ 8.85 M 0.03 ≈ 295 M Shares≈ 0.03 8.85M ≈295M, which can be used to translate per‑share scenarios into directional market‑cap ranges with the caveat that share counts can change materially in micro‑caps over time. On that basis, the 2025 base scenario ($0.5296) implies an illustrative market cap near 0.5296 × 295 M ≈ $ 156 M 0.5296×295M≈$156M, while the 2026 base ($0.697) implies roughly 0.697 × 295 M ≈ $ 206 M 0.697×295M≈$206M, both of which should be treated as scale markers rather than stable targets due to potential financing and corporate actions. Because OTC Pink issuers often experience dilution or restructuring, per‑share outcomes can deviate sharply from static-share calculations, making monitoring of filings and corporate updates essential to keep these translations current.
Risk factors and execution dependencies
The prior Caveat Emptor event, Pink market status, and limited standardized financials create elevated uncertainty in both inputs and forecast outputs, which can drive substantial tracking error versus scenario paths until disclosures and operations mature further. Project, licensing, and arbitration outcomes across Europe can introduce binary risk to value realization timelines, especially where legal and permitting milestones dominate near‑term catalysts rather than recurring operating cash flow. Thin liquidity, wide spreads, and potential corporate actions imply realized investor returns can diverge significantly from modeled averages, especially between 2025 and 2026 when funding and execution needs typically intensify for micro‑caps.
Prediction summary and how to use it
- 2025: external low/base/high of $0.1449/$0.5296/$0.9143 provides the primary scenario envelope for planning, highlighting extreme variance typical of illiquid micro‑caps without robust fundamentals.
- 2026: a transparent CAGR interpolation from the same source’s 2025→2030 path yields low/base/high of approximately $0.191/$0.697/$1.203 to maintain methodological continuity while acknowledging structural uncertainties in share count and liquidity.
- Practical use: treat these bands as directional guides for sizing and risk controls, not as executable price targets, and continuously re‑anchor to new disclosures, capital structure changes, and verified operating milestones for the issuer.