
What DXYZ is

Destiny Tech100 (DXYZ) is a publicly listed, registered closed-end fund designed to provide exposure to leading venture-backed private technology companies, including names such as SpaceX, OpenAI, Stripe, and Discord via secondary-market positions and managed portfolio marks. As a closed-end fund (CEF), DXYZ’s market price can deviate substantially from its reported net asset value (NAV), leading to premiums or discounts driven by supply/demand and sentiment rather than a strict arbitrage linkage.
Why price can diverge from NAV
By structure, CEF shares can trade at a premium when market demand exceeds supply or at a discount when demand wanes, so price moves may reflect premium/discount dynamics even when NAV changes are small. In 2024–2025, DXYZ experienced unusually large premiums versus NAV, highlighting that premium compression alone can cause deep drawdowns despite stable or rising NAV.
Reported NAV baseline
For Q2 2025, Destiny Tech100 reported a NAV of 6.92 USD per share, up from 6.31 USD in Q1 2025, establishing a reliable fundamental baseline for scenario-building into late 2025 and mid‑2026. Using this NAV baseline allows explicit decomposition of future prices into underlying portfolio value and the market’s premium/discount regime in forecasts.
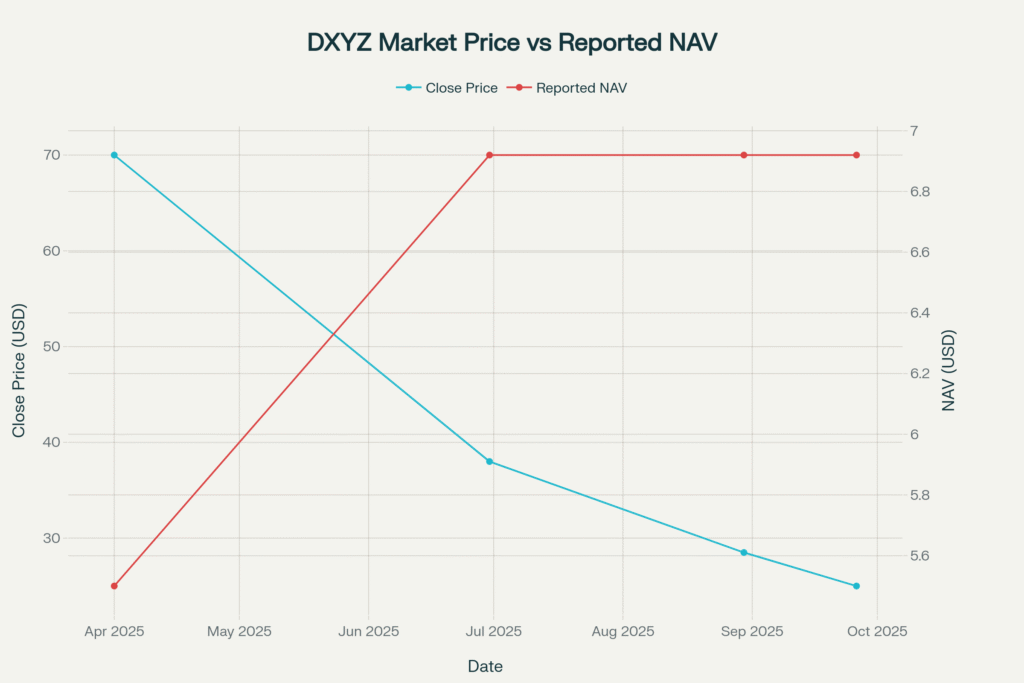
Graph 1: Market price vs NAV snapshots
This chart visualizes how market price snapshots diverged from reported NAV in 2025, illustrating the core two-factor nature of DXYZ pricing. The visible gap underscores why premium analysis is essential to any dxyz stock price prediction for 2025–2026.
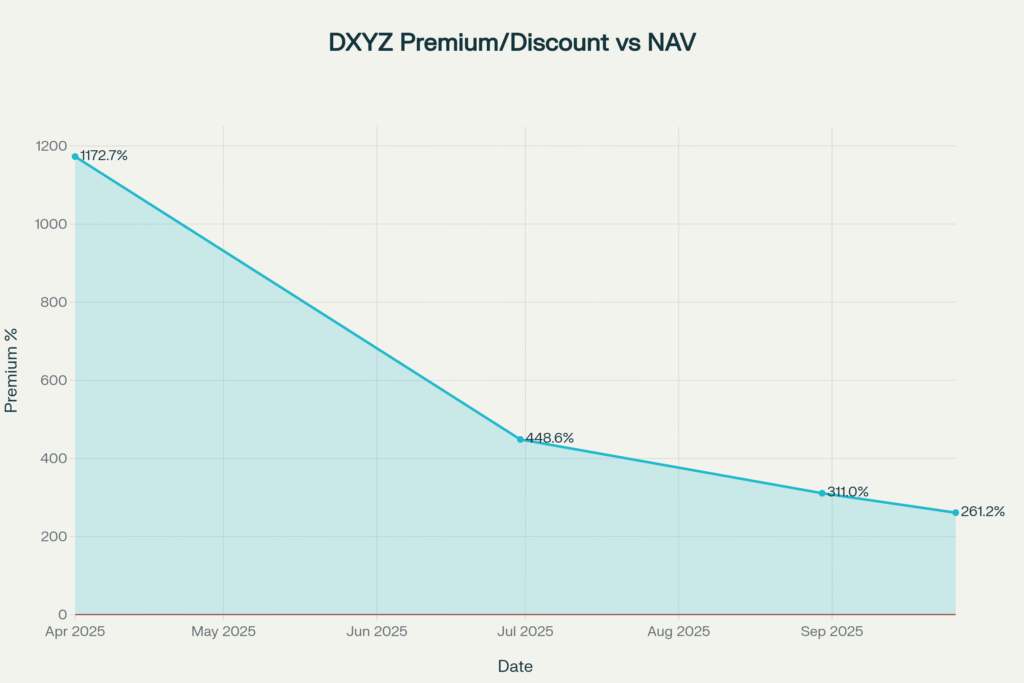
Graph 2: Premium/discount compression
The premium/discount series shows premium falling from extreme readings to still-elevated levels, indicating that de-rating risk remains a central driver of downside scenarios if premium compresses further. Because price equals NAV times one plus premium, small changes in premium can overwhelm moderate NAV changes over short horizons.
Graph 3: Volatility and drawdowns
Through mid-to-late 2025, realized volatility remained high while drawdowns deepened, consistent with rapid repricing of premium rather than large changes in reported NAV. This volatility regime argues for scenario bands rather than point estimates in any dxyz stock price prediction for 2025–2026.

Methodology and formulas
Price is modeled as a function of NAV and the premium/discount applied by the market:
Pricet=NAVt×(1+Premiumt) NAV pathways compound from a reported baseline using NAVt+Δ=NAVt×(1+r)Δ with half‑year Δ=0.5 and one‑year Δ=1.0 while premium regimes are set to reflect plausible compression or expansion around observed history.
Scenario cone: 2025–2026
The scenario cone plots four regimes—Bear, Base, Bull, SuperBull—to end‑2025 and mid‑2026, mechanically transforming NAV projections into prices via the premium/discount identity. The wide dispersion quantifies that premium normalization or re‑expansion will likely dominate price outcomes more than incremental NAV drift in this period.
- End‑2025 Bear: NAV ≈ 6.92, premium ≈ 120%, implied price ≈ 15.18 USD.
- End‑2025 Base: NAV ≈ 7.96, premium ≈ 200%, implied price ≈ 23.88 USD.
- End‑2025 Bull: NAV ≈ 8.99, premium ≈ 250%, implied price ≈ 31.47 USD.
- End‑2025 SuperBull: NAV ≈ 9.69, premium ≈ 300%, implied price ≈ 38.76 USD.
- Mid‑2026 Bear: NAV ≈ 7.27, premium ≈ 100%, implied price ≈ 14.54 USD.
- Mid‑2026 Base: NAV ≈ 8.30, premium ≈ 170%, implied price ≈ 22.41 USD.
- Mid‑2026 Bull: NAV ≈ 9.34, premium ≈ 220%, implied price ≈ 29.89 USD.
- Mid‑2026 SuperBull: NAV ≈ 11.07, premium ≈ 300%, implied price ≈ 44.28 USD.
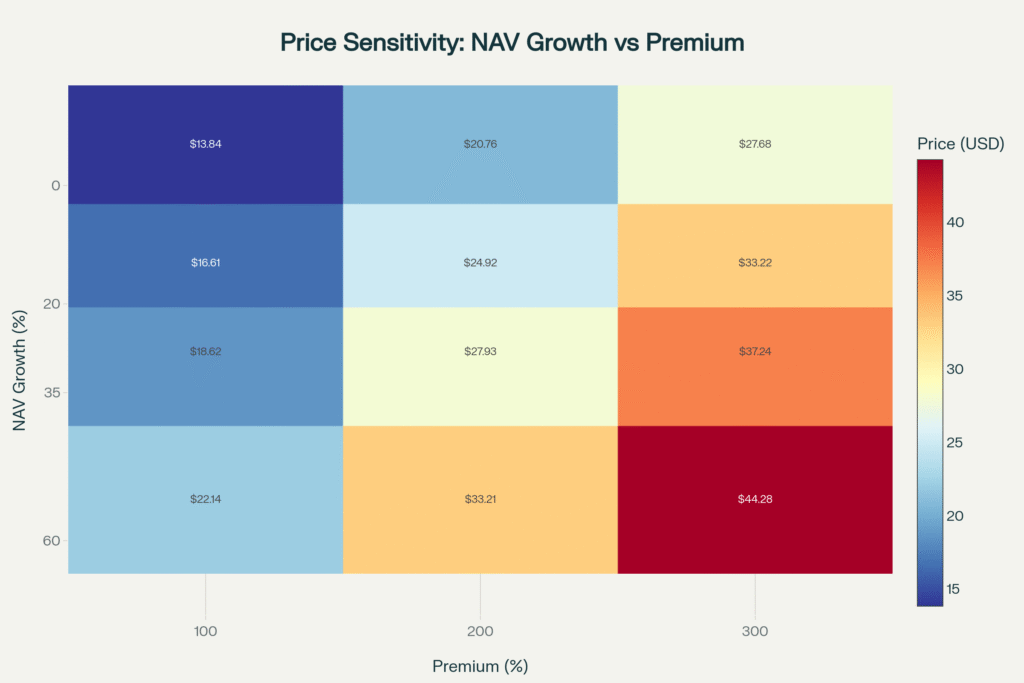
Graph 4: Sensitivity heatmap (premium × NAV growth)
The heatmap shows implied prices across a grid of NAV growth and premium assumptions, making clear that a move from 100% to 300% premium drives far larger price changes than a 0–35% NAV growth shift, other things equal. This diagnostic helps prioritize monitoring of premium drivers when updating dxyz stock price prediction ranges.
Calculation walk‑through (Base cases)
- End‑2025 base path: Start from reported NAV0 = 6.92, apply half‑year growth of 15% to get
- 6.92×(1+0.15)≈7.96 then apply a 200% premium to get
- 7.96×(1+2.00)≈23.88 USD.
- Mid‑2026 base path: From NAV0 = 6.92, apply 20% annual growth to get
- 6.92×(1+0.20)≈8.30 , then apply a 170% premium to get
- 8.30×(1+1.70)≈22.41 USD.
Interpreting growth and downfall
Upside tends to be triggered by premium expansion from headline catalysts such as secondary price marks, liquidity events, or portfolio company milestones, while downside is dominated by premium compression, additional share supply, or sentiment shifts, even when NAV changes little. Given this, the most important near‑term determinant for dxyz stock price prediction is the sustainable premium band rather than small tweaks to NAV forecasts.
What could move the premium
- Private marks and liquidity events at top holdings such as SpaceX, OpenAI, and Stripe can spur premium re‑rating independent of quarter‑to‑quarter NAV changes.
- CEF market structure factors—supply/demand, issuance, and investor risk appetite—can compress or expand the premium quickly versus the slower cadence of NAV reporting.
How to refresh the model
Update with the latest reported NAV from official press releases and filings, recompute the current premium using the most recent market price, and then regenerate the scenario cone and sensitivity heatmap to keep the 2025–2026 ranges current. Because price is a two‑factor output, refreshing both NAV snapshots and the premium regime is essential for a live dxyz stock price prediction.
Graph 5: Complete visual set
Together, the five charts—price vs NAV, premium/discount, volatility and drawdown, scenario cone, and sensitivity heatmap—provide an auditable, assumption‑driven view of 2025–2026 outcomes centered on reported NAV and premium dynamics. This set is designed for quick recalculation as new NAVs, prices, or scenario regimes are observed during 2025–2026.
Sources for facts and method
- Q2 2025 NAV per share = 6.92 USD; Q1 2025 NAV = 6.31 USD (press release coverage and republishers).
- Holdings overview and fund objective confirming private‑tech exposure (SpaceX, OpenAI, Stripe, Discord, Epic Games).
- Closed‑end fund premium/discount mechanics and why price can diverge from NAV.
- Premium history commentary indicating extreme premiums and associated risks of compression.
Bottom line
For 2025–2026, modeled ranges span the mid‑teens to high‑30s into end‑2025 and mid‑teens to mid‑40s by mid‑2026 across bear to super‑bull regimes, with premium behavior driving most of the spread relative to moderate NAV changes. The practical takeaway is to maintain a live, two‑factor process—refresh the latest reported NAV and re‑estimate a sustainable premium band—when updating any dxyz stock price prediction through 2026.