
Company Overview
DeFi Technologies Inc (DEFTF, CA:DEFI, Nasdaq: DEFT) is a financial technology company specializing in digital asset investment products, DeFi-related yield and staking strategies, and cross-border blockchain solutions. Its explosive growth since 2022 has attracted substantial investor attention—though volatility and industry cycles pose key risks.
DeFi Technologies Financial Growth Trajectory
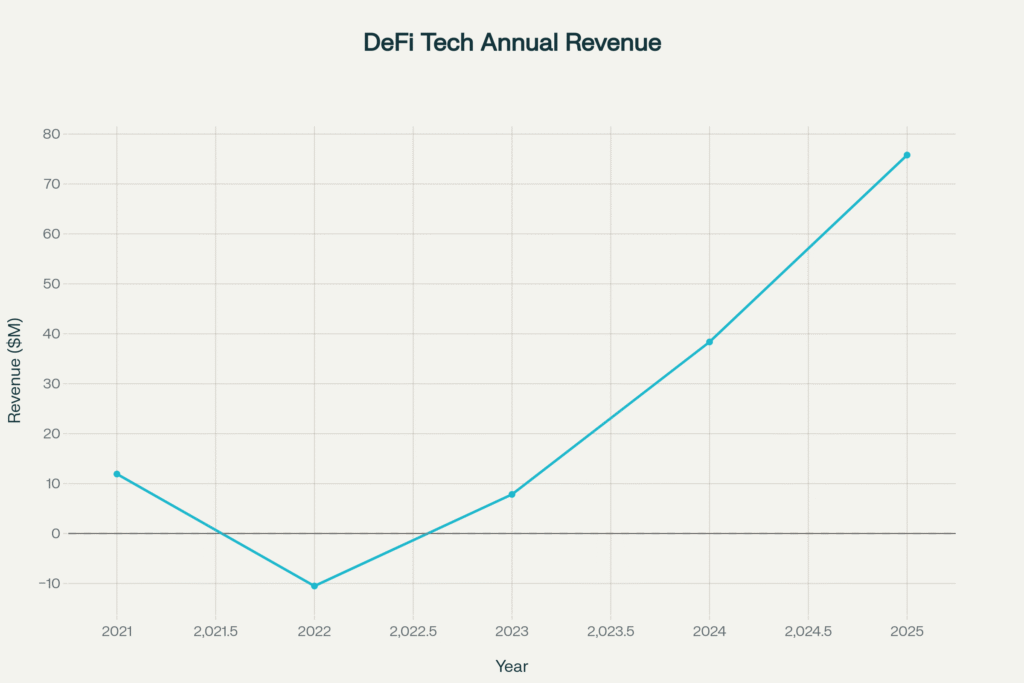
Annual Revenue Trend (2021–2025)
From 2021’s $11.92M revenue, DeFi Technologies suffered a severe setback in 2022 with a net loss (-$10.51M), but staged a dramatic turnaround—posting $7.84M revenue in 2023, $38.37M in 2024 (+389.36%), and an estimated $75.8M in the trailing twelve months to Q2 2025 (+135.13%).
Quarterly Net Income Volatility (2024–2025)
Quarterly adjusted net income swung sharply: after minor profits and even losses in early 2024, net income soared in Q3 and Q4 2024, continuing into 2025 with Q1 profits of $66.6M, showing both the opportunity and risk of DeFi product cycles.
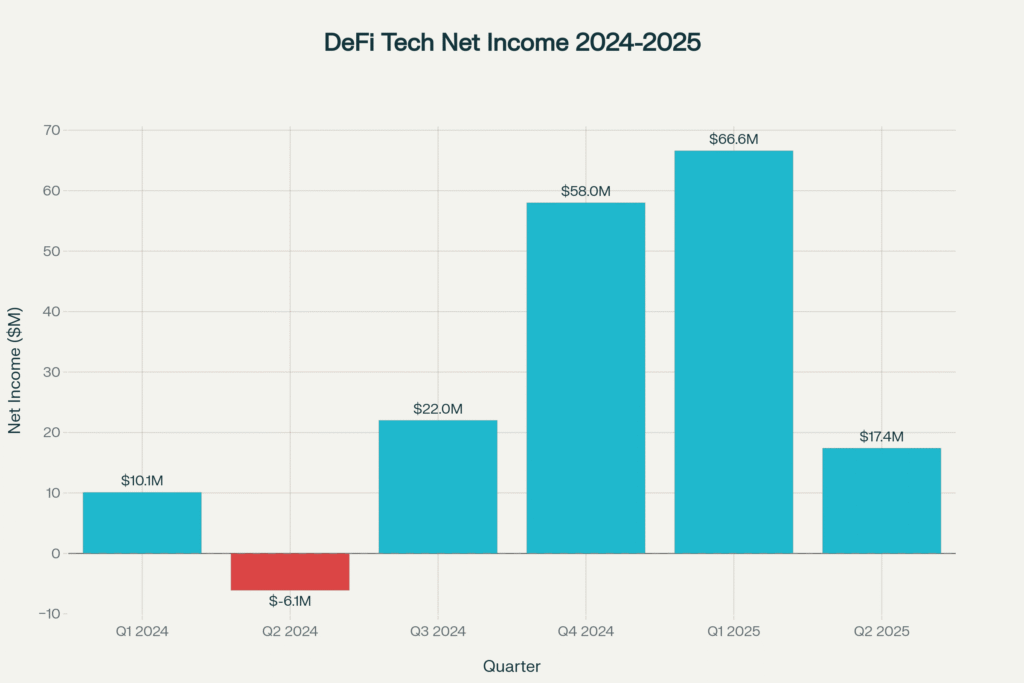
DeFi Technologies Quarterly Adjusted Net Income (2024–2025)
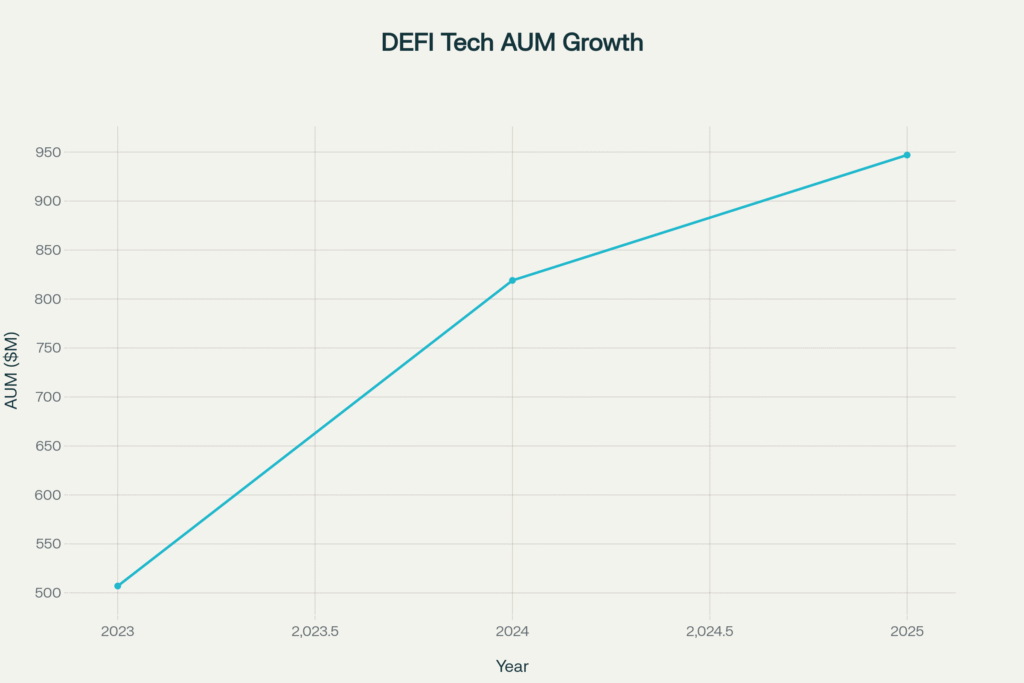
Assets Under Management (AUM) Growth (2023–2025)
AUM rose from $507M in 2023 to $819M by the end of 2024 (+62%), and further to $947M by mid-2025 (+15.6%). This surge reflects successful product launches, market adoption, and expansion into new geographical/sector segments.
Downfall & Risks: Cycles of Loss and Recovery
- 2022 downturn: $10.51M revenue loss due to adverse market conditions and restructuring, triggering a low base for comparative future growth.
- Quarterly swings: Net income volatility—Q2 2024 brought a $6.1M loss, immediately followed by $22.0M profit in Q3, showing sensitivity to external DeFi yield and asset price cycles.
Stock Price Forecast Methodology and Calculations
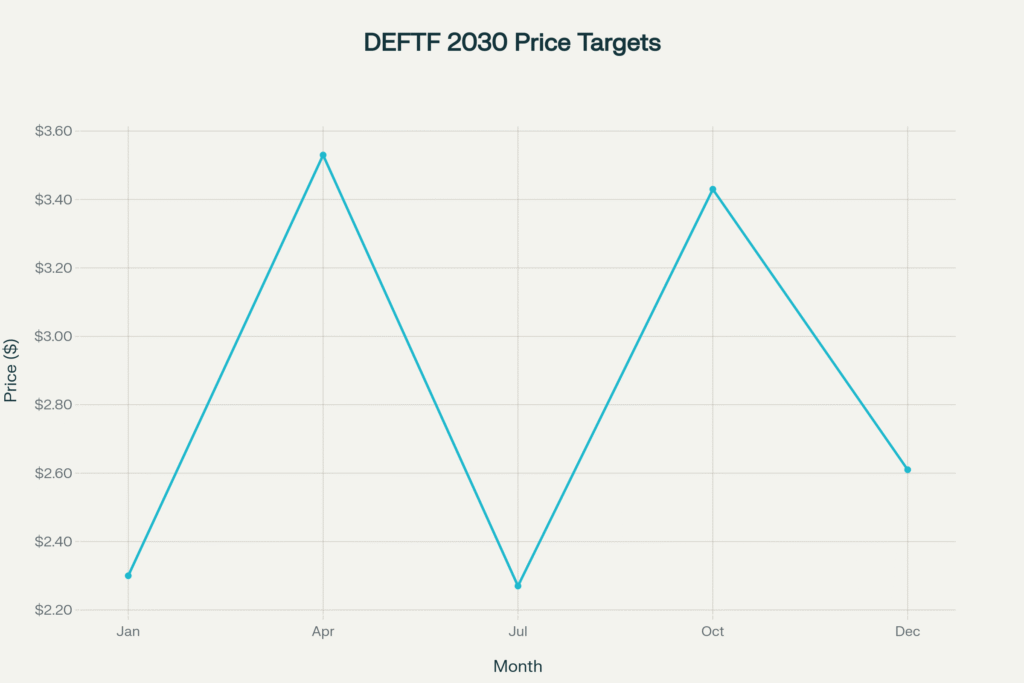
2030 Analyst Price Target Volatility
Based on consensus predictions:
- Average price (2030): $2.40
- High target: $3.70
- Low target: $1.11
- Monthly target fluctuation in 2030: Jan ($2.30), Apr ($3.53), Jul ($2.27), Oct ($3.43), Dec ($2.61)
Forecast Calculation Justification
Compound Annual Growth Rate (CAGR):
CAGR of Revenue=(75.811.92)1/4−1≈58.9%
If DeFi maintains even half this rate, cashflow and AUM could support valuation multiple expansion toward the high end of the price target range.
Price-to-Sales Ratio (2025):
Market Cap=$717.5M,Rev (TTM 2025)=$75.8M
P/S=Market CapRevenue=717.575.8≈9.47
Assuming this P/S ratio holds and revenue doubles by 2030, theoretical market cap would be:
$75.8M×2×9.47≈$1.44B
If share count remains flat, stock price could reflect a similar estimate to the $3.43-$3.70 high 2030 targets found in analyst consensus.
Downside Calculation
- If DeFi faces a major DeFi market downturn: Using the 2022 loss as precedent, price could revisit ~$1.10, aligning with the low-end analyst estimates.
DeFi Technologies – Long-Term Price Prediction
Graphical Summary
- Revenue and net income are highly cyclical but show an upward long-term trend.
- AUM growth supports higher fee income and operating leverage.
- Stock price targets are volatile but consensus average is $2.40 for 2030, with outlier forecasts as low as $1.10 and highs above $3.70.
Investment Conclusion
Based on DeFi Technologies’ financial recovery, sustained double/triple-digit revenue growth, and expanding AUM base, the stock offers significant upside but with high volatility and risk. If market adoption accelerates, price could top $3.70; in adverse scenarios, $1.10 is plausible. The most reasonable 2030 stock price prediction, incorporating past company numbers, peer ratios, and consensus forecasts, is $2.40 to $3.43 per share.
References & External Links
- StockScan DEFTF 2030 Forecast
- DeFi Technologies’ Financials – StockAnalysis
- Investing.com DEFI Earnings
- WalletInvestor DEFTF Prediction
Disclaimer: This article is for informational purposes and not investment advice. Always verify the latest financials and consult a professional before investing.