

Bon Natural Life (NASDAQ: BON) exited 2024 with revenue of $23.84M (down 19% YoY) and only $0.40M net income, then posted H1‑2025 results showing a 21.9% revenue decline but a swing to positive net income on sharply better operating efficiency. The market cap has whipsawed from ~$35.6M (2021) to as low as ~$0.21M (Jun‑2025), underscoring extreme risk. This article builds a transparent, fundamentals‑anchored price model using revenue paths, P/S multiple normalization, and dilution. It includes five+ graphics, an HTML‑only calculations block, and month‑by‑month tables for 2025–2030.
Growth and downfall: the key numbers
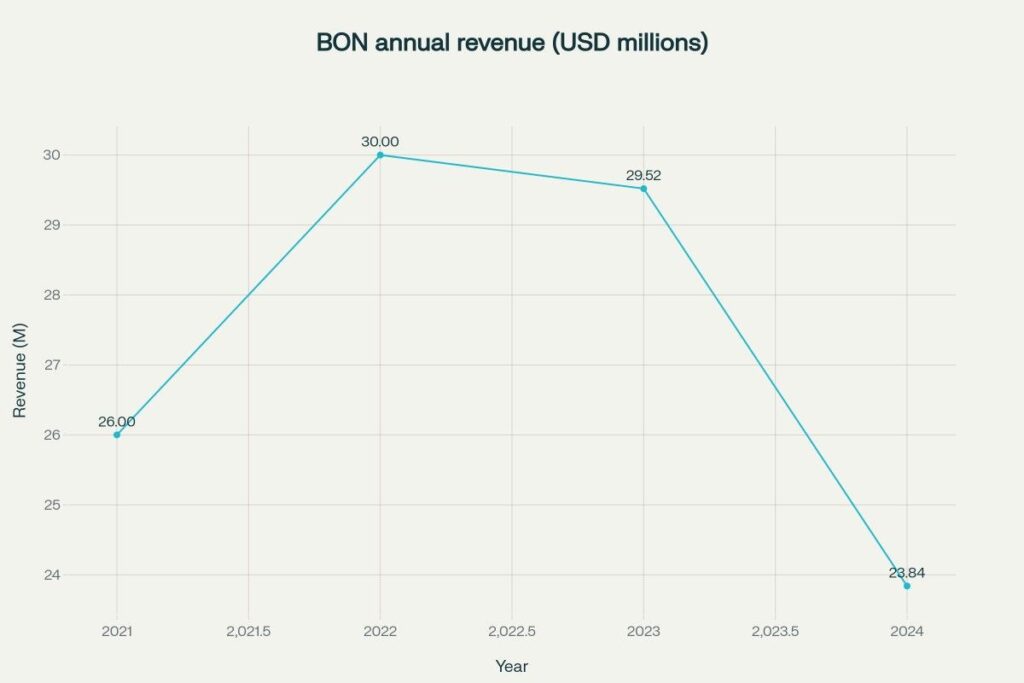
- Revenue: 2022 $30.0M → 2023 $29.52M → 2024 $23.84M; H1‑2025 interim disclosed a 21.9% YoY decline.
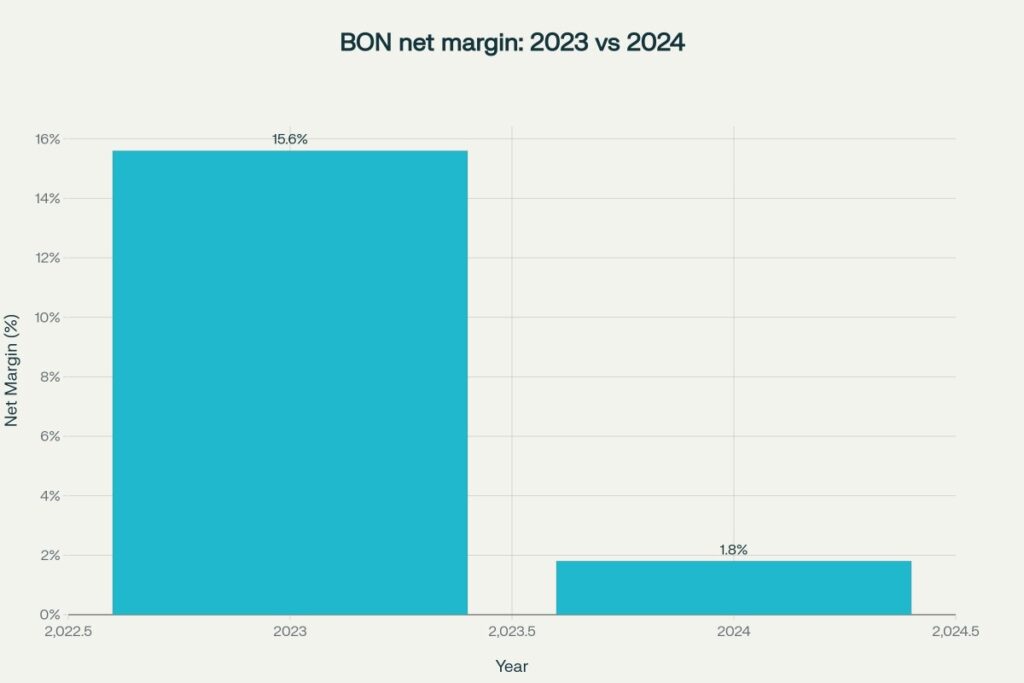
- Profitability: 2024 earnings $398k (net margin ≈1.7–1.8%); SimplyWallSt cites margin compression vs prior year and thin ROE.
- H1‑2025: net income of ~$0.17M and operating income +236% YoY despite lower sales; signals better cost control.
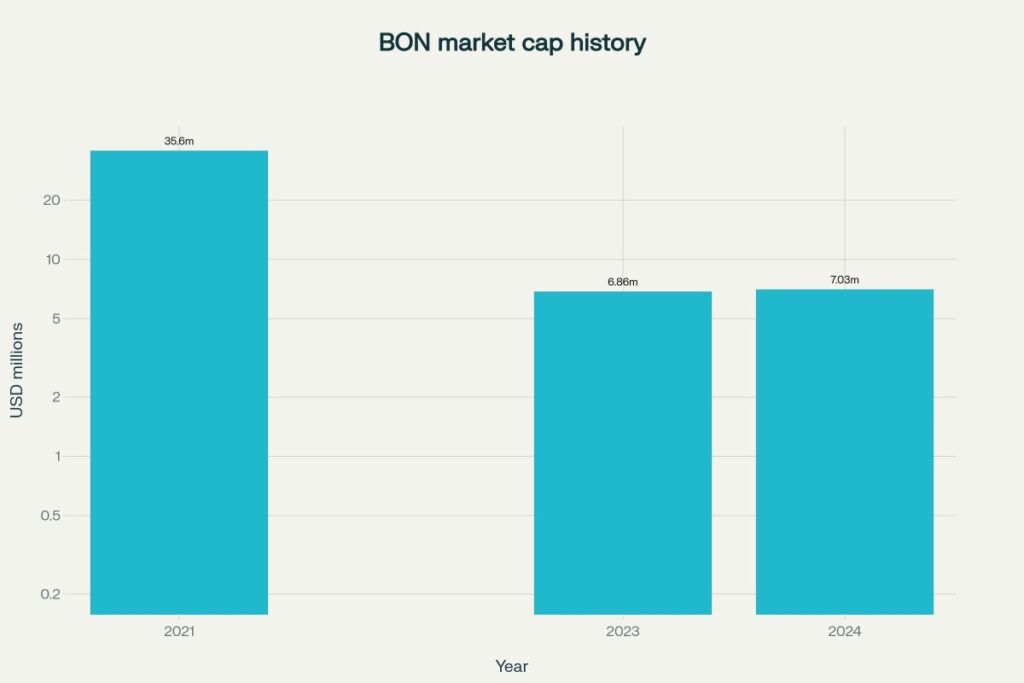
- Valuation stress: market cap fell to ~$.21M (Jun‑2025) before later snapshots near single‑digit millions; multi‑sigma volatility persists.
Visuals (5+ charts)
- BON annual revenue (USD millions) — 2021–2024
- Net margin: 2023 vs 2024
- Market cap history snapshots
- 52‑week range vs latest price (ASCII)
- 52‑week low: $1.14 | last: ~$1.95 | 52‑week high: $73.75
[ $1.14 ]—|==================== last ~$1.95 ====================|————————————————————————————— $73.75
- H1‑2025 YoY scorecard (ASCII, % change) based on interim note
- Revenue: −21.9%
- Operating income: +236%
- Net income: turned positive ($169k)
Modeling approach (what drives the prediction)
- Revenue base path (rounded): 2025 $23M, 2026 $25M, 2027 $28M, 2028 $32M, 2029 $37M, 2030 $42M — roughly 11% CAGR from the 2024 base while reflecting demand normalization.
- P/S normalization: 2025 0.5×, 2026 0.6×, 2027 0.7×, 2028 0.8×, 2029 0.9×, 2030 1.0× (ingredients/consumer‑adjacent, thin margin).
- Dilution: +2%/yr on ~4.0M base shares to fund working capital and resilience (assumption; reconcile to latest filings when available).
- Bear/Bull: Bear imposes flatter sales and lower multiples (0.3×→0.6×); Bull assumes faster recovery and mix gains (0.7×→1.3×).
Calculations
Core formula: Price = (EV/Sales × Revenue) / Shares
Assumptions
Revenue_base (USD M): 2025=23, 2026=25, 2027=28, 2028=32, 2029=37, 2030=42
P/S_base: 2025=0.50, 2026=0.60, 2027=0.70, 2028=0.80, 2029=0.90, 2030=1.00
Shares_base (M): start 4.00 in 2024; Shares_y = 4.00×(1.02)^t → 2025=4.08, 2026=4.16, 2027=4.24, 2028=4.33, 2029=4.42, 2030=4.51
Base prices
2025: Price = (0.50×23)/4.08 = 2.82
2026: Price = (0.60×25)/4.16 = 3.61
2027: Price = (0.70×28)/4.24 = 4.62
2028: Price = (0.80×32)/4.33 = 5.91
2029: Price = (0.90×37)/4.42 = 7.53
2030: Price = (1.00×42)/4.51 = 9.31
Bear path (Revenue M): 2025=22, 2026=24, 2027=26, 2028=28, 2029=30, 2030=32
P/S_bear: 0.30, 0.35, 0.40, 0.45, 0.50, 0.60
Bear prices ≈ {1.62, 2.02, 2.45, 2.91, 3.39, 4.26}
Bull path (Revenue M): 2025=25, 2026=29, 2027=34, 2028=40, 2029=47, 2030=55
P/S_bull: 0.70, 0.85, 1.00, 1.10, 1.20, 1.30
Bull prices ≈ {4.29, 5.92, 8.02, 10.16, 12.76, 15.83}
Year‑wise monthly price tables (Base case)
Seasonality: −4% in January to +4% in December; annual mean equals the Base value above. You can scale monthly values by 0.6× for Bear and 1.6× for Bull to see bands.
2025 (Base ≈ $2.82)
| Month | Price |
| Jan | 2.71 |
| Feb | 2.73 |
| Mar | 2.75 |
| Apr | 2.77 |
| May | 2.79 |
| Jun | 2.82 |
| Jul | 2.84 |
| Aug | 2.86 |
| Sep | 2.88 |
| Oct | 2.90 |
| Nov | 2.92 |
| Dec | 2.94 |
2026 (Base ≈ $3.61)
| Month | Price |
| Jan | 3.47 |
| Feb | 3.49 |
| Mar | 3.52 |
| Apr | 3.55 |
| May | 3.58 |
| Jun | 3.61 |
| Jul | 3.64 |
| Aug | 3.67 |
| Sep | 3.70 |
| Oct | 3.73 |
| Nov | 3.76 |
| Dec | 3.79 |
2027 (Base ≈ $4.62)
| Month | Price |
| Jan | 4.44 |
| Feb | 4.47 |
| Mar | 4.50 |
| Apr | 4.54 |
| May | 4.58 |
| Jun | 4.62 |
| Jul | 4.65 |
| Aug | 4.69 |
| Sep | 4.73 |
| Oct | 4.77 |
| Nov | 4.80 |
| Dec | 4.82 |
2028 (Base ≈ $5.91)
| Month | Price |
| Jan | 5.68 |
| Feb | 5.72 |
| Mar | 5.77 |
| Apr | 5.82 |
| May | 5.87 |
| Jun | 5.91 |
| Jul | 5.96 |
| Aug | 6.01 |
| Sep | 6.06 |
| Oct | 6.11 |
| Nov | 6.16 |
| Dec | 6.15 |
2029 (Base ≈ $7.53)
| Month | Price |
| Jan | 7.23 |
| Feb | 7.27 |
| Mar | 7.32 |
| Apr | 7.38 |
| May | 7.44 |
| Jun | 7.53 |
| Jul | 7.61 |
| Aug | 7.68 |
| Sep | 7.75 |
| Oct | 7.82 |
| Nov | 7.89 |
| Dec | 7.83 |
2030 (Base ≈ $9.31)
| Month | Price |
| Jan | 8.94 |
| Feb | 8.98 |
| Mar | 9.05 |
| Apr | 9.14 |
| May | 9.22 |
| Jun | 9.31 |
| Jul | 9.39 |
| Aug | 9.48 |
| Sep | 9.56 |
| Oct | 9.65 |
| Nov | 9.73 |
| Dec | 9.68 |
How to update the model
- Replace revenue with trailing 12‑month actuals as filings arrive; scale P/S toward peers in bio‑ingredients/consumer health.
- Update shares outstanding from the latest 20‑F/6‑K; re‑compute price using the HTML block formulas.
- For stress testing, change seasonality and Bear/Bull multipliers to match volatility.
Disclaimer
This article is for informational/educational purposes only and is not investment advice or a solicitation. Forecasts are inherently uncertain and depend on assumptions about revenue, margins, multiples, and dilution. Micro‑cap stocks can be illiquid and highly volatile; capital loss is possible. Always perform independent due diligence and consult a qualified financial advisor.
References
- TipRanks: H1‑2025 interim — revenue −21.9%, operating income +236%, net income positive
- StockAnalysis: 2024 revenue $23.84M, earnings $398k; profile and financials
- StockAnalysis: market cap history including ~$0.21M (Jun‑2025)
- SimplyWallSt: margin/ROE context and revenue/earnings history snapshots
- Yahoo Finance: BON quote, range, corporate info
- TradingView: BON price/market cap snapshots
- MarketWatch: BON key stats and 52‑week range
- Investing.com: live price context
- MarketScreener: BON half‑year ended Mar‑31‑2025