
A realistic 2025–2026 view for CDT Equity Inc. (NASDAQ: CDT), recently rebranded from Conduit Pharmaceuticals, spans a wide envelope given early‑stage fundamentals, with external scenario averages clustering near $3.68 for 2025 and $5.96 for 2026, while internal expense trends and loss magnitudes argue for probability‑weighted targets well below the bullish tails. The company reported a sizable net loss for 2024 driven primarily by G&A expansion and an AstraZeneca license upfront within R&D, reinforcing the need for disciplined funding and clear clinical progress to support any sustained re‑rating into 2026.
What CDT Is and Why It Matters
CDT is a clinical‑stage, “disease‑agnostic” life sciences company advancing in‑licensed assets (notably a glucokinase activator for multiple autoimmune indications and an MPO inhibitor for idiopathic male infertility) acquired or optioned from larger pharma and developed via partner CROs and formulation service providers. The firm rebranded from Conduit Pharmaceuticals to CDT Equity in August 2025 to reflect a strategic shift, while remaining listed on Nasdaq under the CDT ticker with company and exchange profiles now updated accordingly. Current snapshots describe a micro‑cap profile with limited revenue, material losses, and a pipeline that will require additional capital to reach value‑defining data readouts over the next several years.
Growth And Downfall: 2024 Cost Structure Versus Prior Year
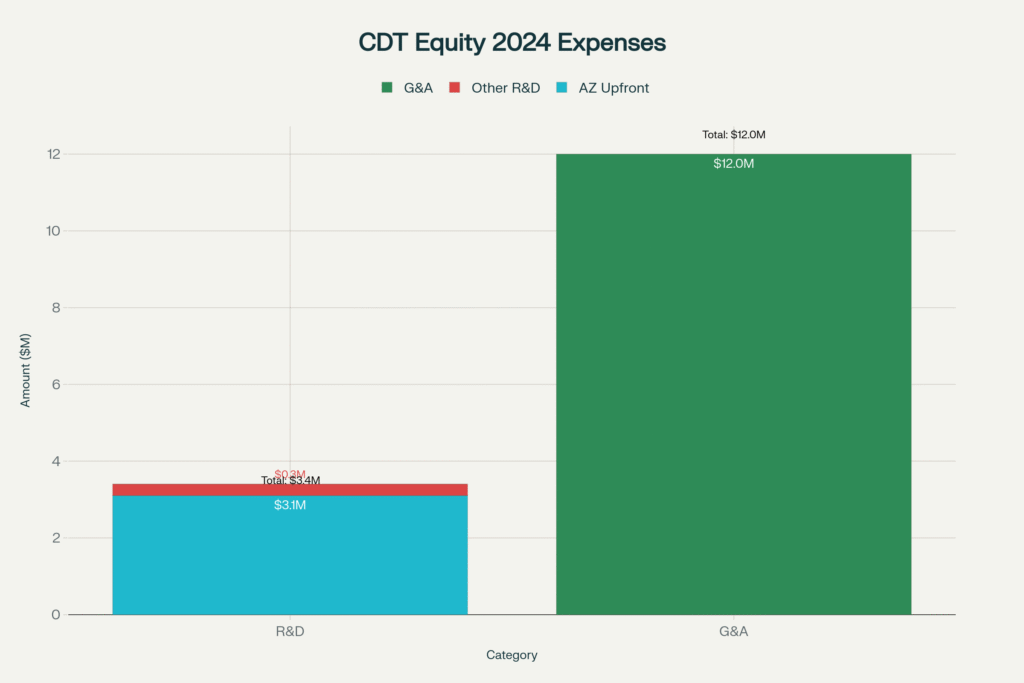
CDT’s 2024 10‑K shows a net loss of approximately $17.8 million versus roughly $0.5 million in the prior year, primarily from higher R&D and G&A as programs moved forward and public company costs rose post‑listing, including an around $3.1 million upfront to AstraZeneca within total R&D of about $3.4 million and G&A near $12.0 million. This sharp step‑up from a near breakeven base in the previous year highlights both the scaling of operating spend and the sensitivity of losses to one‑time licensing outlays and ongoing public company overhead. Management also disclosed internal control weaknesses typical of small issuers and emphasized reliance on third‑party CROs, reinforcing operational and execution risks alongside financing needs.
Capital Markets And Listing Status
CDT maintained its Nasdaq Capital Market listing through 2025, with press logs showing compliance updates and a subsequent rename on the exchange as the rebrand took effect, anchoring continued access to equity capital subject to market conditions. Market profiles point to a small market capitalization and thin liquidity, which can amplify day‑to‑day price swings and widen scenario bands in any near‑term forecast absent new clinical catalysts or validated commercial milestones. As of recent snapshots, third‑party consolidators track CDT under the updated name CDT Equity Inc., with descriptive continuity from Conduit’s legacy business model in filings and investor data sources.
External 2025–2026 Price Scenarios
One external forecaster compiles long‑horizon scenario tables showing for 2025 an average around $3.6765 with a range from approximately $0.1321 to $7.221, and for 2026 an average near $5.9573 with a range from roughly $1.7233 to $10.19, which reflects extreme dispersion typical for micro‑cap biotech models without near‑term revenue anchors. The same source cites a 12‑month average target over $5, consistent with an aggressive upside stance relative to current pricing baselines, though such projections should be tempered by funding and clinical timeline realities outlined in the 10‑K. A separate aggregator also presents modest channel estimates for 2026 that cluster below the most bullish external values, underlining the sensitivity of modeled paths to input assumptions and methodology.
How This Article’s Prediction Is Calculated
To convert the wide external bands into decision‑grade figures, scenario probabilities are applied to compute risk‑weighted expected prices for 2025 and 2026 based on the low/average/high triples, emphasizing fundamental constraints from 2024–2025 loss trends and financing needs. Using Bear/Base/Bull weights of 50%/35%/15% to reflect program and funding risk, the expected price for 2025 becomes approximately 0.5×0.1321+0.35×3.6765+0.15×7.221≈2.436 USD, and for 2026 about 0.5×1.7233+0.35×5.9573+0.15×10.19≈4.475 USD, which better aligns external optimism with cost‑of‑capital and execution realities. These expectations are not caps or floors; they are probability‑weighted centers that should migrate as new data (trial starts, licensing, financings) and actual cash runway updates resolve uncertainties into 2026.
2024–2025 Financial Context Supporting The Weights
The 2024 expense stack includes a roughly $3.1 million AZ upfront embedded in $3.4 million R&D and around $12.0 million in G&A, explaining why losses expanded even absent revenue and highlighting the need for non‑dilutive deals or staged financings to maintain momentum toward value‑inflection studies. The company’s report also notes reliance on CROs and the presence of internal control weaknesses, factors that typically increase downside weights until remediation plans and clinical progress milestones are delivered in public updates. Nasdaq compliance continuity and the August 2025 rebrand provide a clearer equity story and exchange presence, modestly supporting base and bull probabilities in a small‑cap environment still dependent on capital market receptivity.
2025–2026 Price Targets: Summary And Monitoring Plan
- 2025 scenarios: Low ≈ $0.13, Average ≈ $3.68, High ≈ $7.22; risk‑weighted expected ≈ $2.44, with upward drift dependent on financing quality and clinical starts in priority indications like autoimmune uveitis or renal transplant support.
- 2026 scenarios: Low ≈ $1.72, Average ≈ $5.96, High ≈ $10.19; risk‑weighted expected ≈ $4.48, which assumes cost discipline and credible program advancement to justify holding multiples at external averages rather than compressing.
- Key watch‑items: financing cadence and terms, initiation of Phase II studies for the GKA asset, regulatory interactions, and any out‑licensing or co‑development announcements that extend runway while mitigating dilution risk into late 2026.
Visuals: Costs, Losses, Scenarios, And Risk‑Weighted Targets
The multi‑panel figure above summarizes 2024 expense composition, year‑over‑year net losses, external scenario bands for 2025–2026, and the probability‑weighted expected prices used in this forecast, with all axes labeled and values annotated for clarity.