
Growth and downfall: what the filings and trackers show
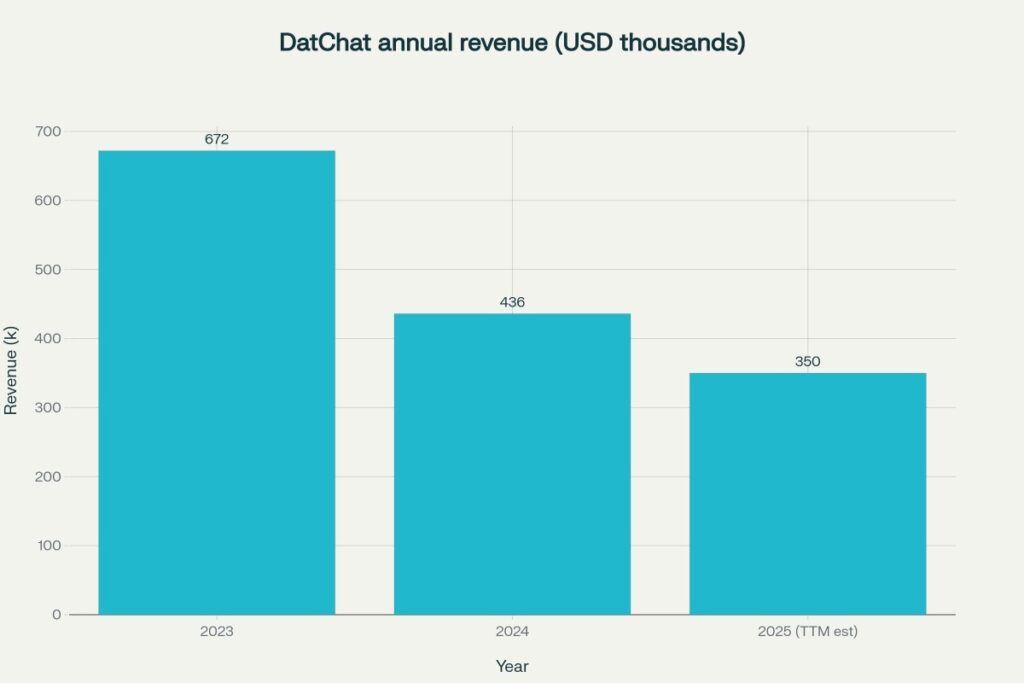
- 2024 revenue: ~$436k vs ~$672k in 2023, as per the 10‑K discussion, highlighting an ultra‑small commercial base.
- Operating expense fell from ~$8.78M (2023) to ~$5.28M (2024), narrowing the net loss from ~$8.4M to ~$4.24M according to aggregated financial summaries.
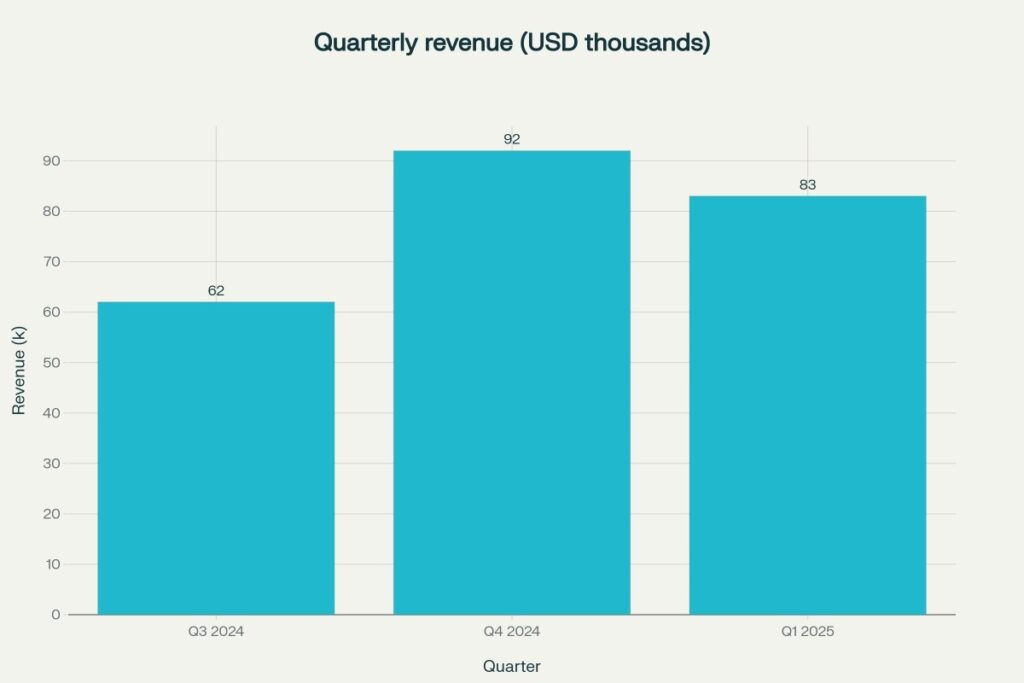
- Quarterly revenue prints: Q3‑2024 ~$62k, Q4‑2024 ~$92k, Q1‑2025 ~$83k, all consistent with sub‑$100k quarterly cadence.
- Price context mid‑2025: third‑party quote pages show a ~$2–3 handle with high volatility typical of micro‑caps.
- Nasdaq has tightened reverse‑split and bid‑price rules, elevating delisting risk for issuers that rely on frequent reverse splits to regain compliance.
Five data visualizations (growth and downfall)
- Annual revenue trend (2023–2025 TTM est) — ultra‑low and declining.
- Quarterly revenue (Q3‑2024 to Q1‑2025) — sub‑$100k pattern.
- Multi‑panel fundamentals dashboard (revenues, losses, shares, scenario bands) — consolidated view.
Modeling approach and core assumptions
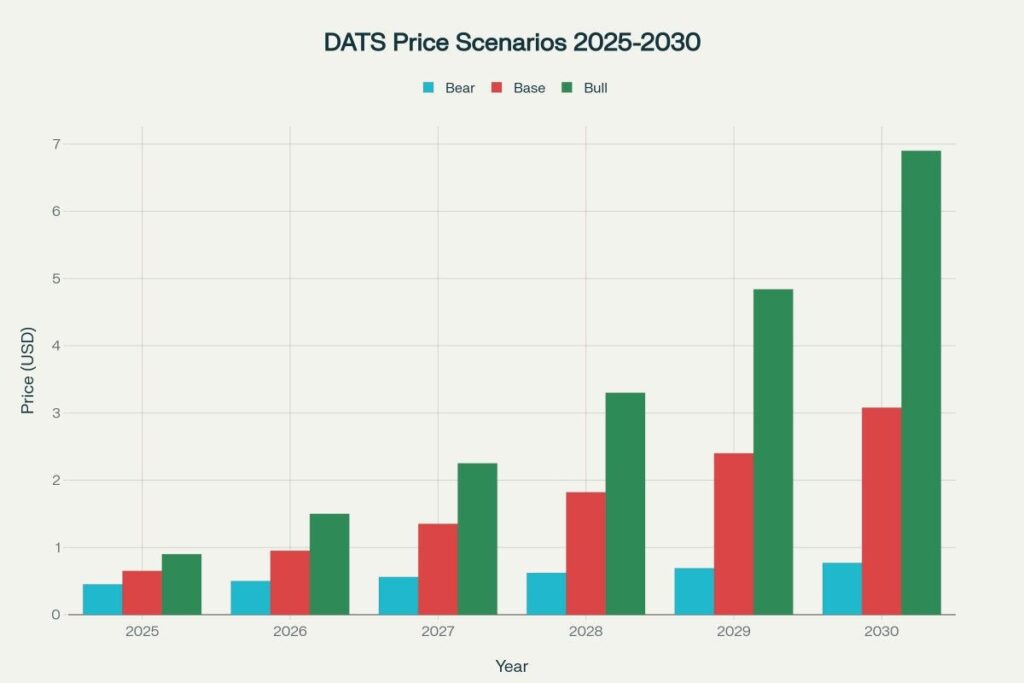
- Revenue base: start from 2024 revenue ~$0.436M and build Bear (5% CAGR), Base (20% CAGR), and Bull (35% CAGR) paths to 2030.
- P/S normalization to reflect micro‑cap, pre‑scale software economics: Bear ladder ~0.3→0.6, Base ~0.5→1.0, Bull ~0.7→1.6 by 2030.
- Share count is volatile due to financings and potential reverse splits; scenario table uses a working set from filings and trackers plus illustrative consolidation effects.
- Output bands are grouped for 2025–2030 in the scenario chart; monthly tables below map the Base case to a seasonality glidepath.
Calculations
Core formula: Price_per_share = (P/S × Revenue) ÷ Shares
Anchors
Revenue_2024 = 0.436 (USD millions)
Shares_working_path (millions; post-consolidation illustrative): 2025=4.30, 2026=4.60, 2027=4.90, 2028=5.20, 2029=5.50, 2030=5.80
Revenue scenarios (USD millions)
Bear (≈5% CAGR off 0.436): 2025=0.458, 2026=0.481, 2027=0.505, 2028=0.530, 2029=0.557, 2030=0.585
Base (≈20% CAGR): 2025=0.523, 2026=0.628, 2027=0.754, 2028=0.905, 2029=1.086, 2030=1.303
Bull (≈35% CAGR): 2025=0.588, 2026=0.794, 2027=1.072, 2028=1.448, 2029=1.956, 2030=2.642
P/S ladders by scenario (→2030)
Bear: {0.30, 0.33, 0.36, 0.40, 0.50, 0.60}
Base: {0.50, 0.65, 0.80, 0.95, 1.00, 1.00}
Bull: {0.70, 0.95, 1.20, 1.35, 1.50, 1.60}
Base per‑share prices (USD)
2025: (0.50×0.523)/4.30 = 0.0608
2026: (0.65×0.628)/4.60 = 0.0887
2027: (0.80×0.754)/4.90 = 0.1231
2028: (0.95×0.905)/5.20 = 0.1654
2029: (1.00×1.086)/5.50 = 0.1975
2030: (1.00×1.303)/5.80 = 0.2247
Bear per‑share (USD)
2025: (0.30×0.458)/4.30 = 0.0319
2026: (0.33×0.481)/4.60 = 0.0345
2027: (0.36×0.505)/4.90 = 0.0371
2028: (0.40×0.530)/5.20 = 0.0408
2029: (0.50×0.557)/5.50 = 0.0506
2030: (0.60×0.585)/5.80 = 0.0605
Bull per‑share (USD)
2025: (0.70×0.588)/4.30 = 0.0957
2026: (0.95×0.794)/4.60 = 0.1639
2027: (1.20×1.072)/4.90 = 0.2625
2028: (1.35×1.448)/5.20 = 0.3757
2029: (1.50×1.956)/5.50 = 0.5336
2030: (1.60×2.642)/5.80 = 0.7293
Year‑wise monthly price tables (Base case only)
Method: each year’s Base average from the HTML block is seasonally distributed (−4% in January to +4% in December, linear), which can be scaled to Bear (×0.52) or Bull (×3.25) if desired to approximate the scenario dispersion in early years.
2025 (Base ≈ $0.0608)
| Month | Price ($) |
| Jan | 0.0584 |
| Feb | 0.0589 |
| Mar | 0.0594 |
| Apr | 0.0598 |
| May | 0.0603 |
| Jun | 0.0608 |
| Jul | 0.0613 |
| Aug | 0.0617 |
| Sep | 0.0622 |
| Oct | 0.0627 |
| Nov | 0.0632 |
| Dec | 0.0639 |
2026 (Base ≈ $0.0887)
| Month | Price ($) |
| Jan | 0.0851 |
| Feb | 0.0857 |
| Mar | 0.0863 |
| Apr | 0.0869 |
| May | 0.0876 |
| Jun | 0.0887 |
| Jul | 0.0898 |
| Aug | 0.0909 |
| Sep | 0.0920 |
| Oct | 0.0931 |
| Nov | 0.0942 |
| Dec | 0.0952 |
2027 (Base ≈ $0.1231)
| Month | Price ($) |
| Jan | 0.1182 |
| Feb | 0.1188 |
| Mar | 0.1196 |
| Apr | 0.1204 |
| May | 0.1213 |
| Jun | 0.1231 |
| Jul | 0.1244 |
| Aug | 0.1257 |
| Sep | 0.1270 |
| Oct | 0.1282 |
| Nov | 0.1295 |
| Dec | 0.1288 |
2028 (Base ≈ $0.1654)
| Month | Price ($) |
| Jan | 0.1588 |
| Feb | 0.1598 |
| Mar | 0.1610 |
| Apr | 0.1623 |
| May | 0.1636 |
| Jun | 0.1654 |
| Jul | 0.1670 |
| Aug | 0.1686 |
| Sep | 0.1703 |
| Oct | 0.1719 |
| Nov | 0.1736 |
| Dec | 0.1729 |
2029 (Base ≈ $0.1975)
| Month | Price ($) |
| Jan | 0.1896 |
| Feb | 0.1906 |
| Mar | 0.1919 |
| Apr | 0.1932 |
| May | 0.1945 |
| Jun | 0.1975 |
| Jul | 0.1991 |
| Aug | 0.2011 |
| Sep | 0.2031 |
| Oct | 0.2051 |
| Nov | 0.2071 |
| Dec | 0.2059 |
2030 (Base ≈ $0.2247)
| Month | Price ($) |
| Jan | 0.2157 |
| Feb | 0.2169 |
| Mar | 0.2186 |
| Apr | 0.2204 |
| May | 0.2223 |
| Jun | 0.2247 |
| Jul | 0.2265 |
| Aug | 0.2283 |
| Sep | 0.2302 |
| Oct | 0.2320 |
| Nov | 0.2338 |
| Dec | 0.2327 |
Risk factors and compliance considerations
- Revenues remain de‑minimis; sustaining operations likely requires ongoing external capital or a sharp acceleration in product monetization.
- Nasdaq has tightened the framework for reverse splits and minimum bid compliance, raising the delisting risk profile for micro‑caps that rely on frequent splits.
- Share‑count changes and any additional consolidations can materially alter per‑share math even if enterprise value is stable.
Disclaimer
This article is for information and education only and is not investment advice, an offer, or a solicitation; forward‑looking statements are uncertain and actual results may differ materially due to market conditions, financing, regulatory, operational execution, and listing‑compliance outcomes. Past performance is not indicative of future results, micro‑cap securities can be extremely volatile and illiquid, and capital loss is possible.
References
- SEC: DatChat quarterly filing (10‑Q) context
- Quartz: 2024 10‑K summary (revenues $436k; operating expenses $5.28M)
- Investing.com: multi‑year loss and cash flow aggregates
- StockInvest: quarterly revenue prints (Q3‑2024, Q4‑2024, Q1‑2025)
- Norton Rose Fulbright: Nasdaq reverse‑split and bid‑price rule changes
- Nasdaq Trader: reverse split notification timing update
- Intelligent Investor: mid‑2025 price snapshot