
Foremost Clean Energy Ltd. (NASDAQ: FMST; formerly Foremost Lithium) is an exploration‑stage uranium and lithium company with Athabasca Basin uranium options and a secondary lithium portfolio, so valuation depends more on exploration progress, resource scale, and commodity prices than near‑term operating earnings. The 2025 trading baseline reflects a regained‑compliance period and event‑driven volume spikes, making scenario‑based forecasting more appropriate than single‑point targets.
Company snapshot
Foremost is an exploration company focused on uranium (primary) and lithium (secondary) across North America, with a name change to Foremost Clean Energy in 2024 and listings on NASDAQ (FMST) and CSE (FAT). The company’s Athabasca Basin footprint includes options to earn up to 70% interest across 10 uranium properties spanning over 330,000 acres, with lithium acreage of 50–55k+ acres in Manitoba and Quebec.
Growth and downfall structure
- Growth vectors: property acquisition, systematic exploration (geophysics, drilling), de‑risking of targets to resource definitions, and leverage to uranium prices amid the clean‑energy build‑out.
- Downfall drivers: exploration setbacks, capital‑market constraints typical of pre‑revenue juniors, commodity drawdowns, and compliance or liquidity pressures for small‑cap listings.
Methods and formulas
The forecast uses a two‑layer approach: fundamental anchors (resource scale × commodity price × EV/Sales proxy) and market path mechanics from current price via scenario CAGR and multiple regimes.
- Price translation (simplified): Equity ≈ EV − NetDebt , Price ≈ EV Diluted Shares Equity≈EV−NetDebt,Price≈ Diluted Shares EV with EV guided by project value proxies at different exploration states.
- Scenario pathing: within each year, monthly values linearly interpolate from January to December toward the year‑end scenario anchor.
- Sensitivity framing: valuation index grid across resource size (Mt) and uranium price ($/lb) to show macro/geology leverage.
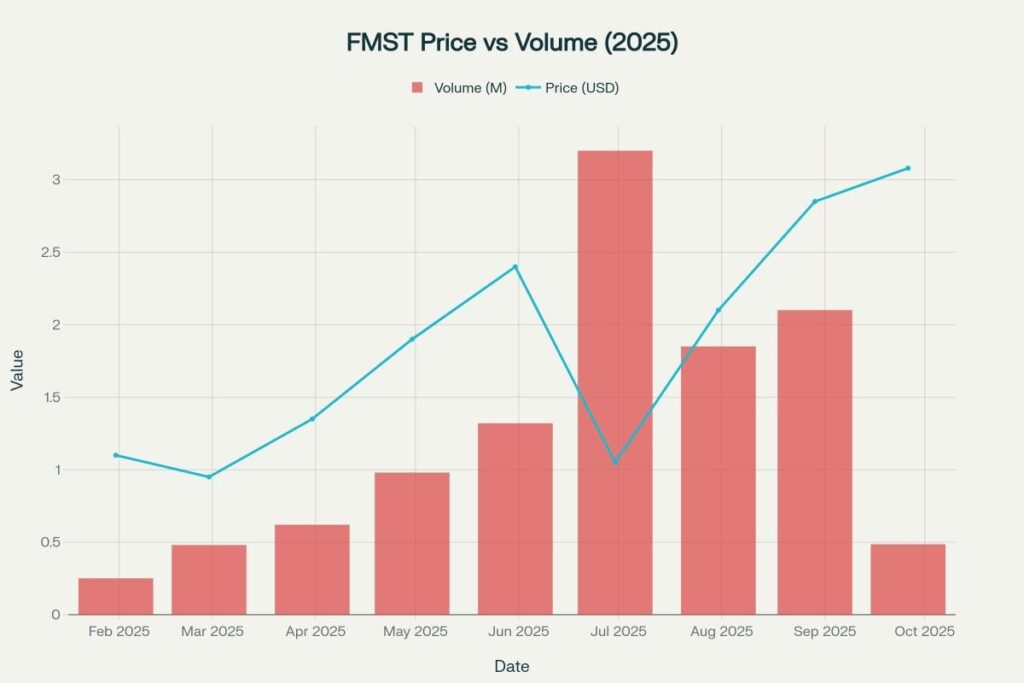
Market behavior: price vs volume (2025)
FMST’s 2025 trend shows event‑driven bursts with a late‑Q3 close near 3.08 USD, consistent with regained compliance newsflow and small‑cap liquidity dynamics that amplify moves.
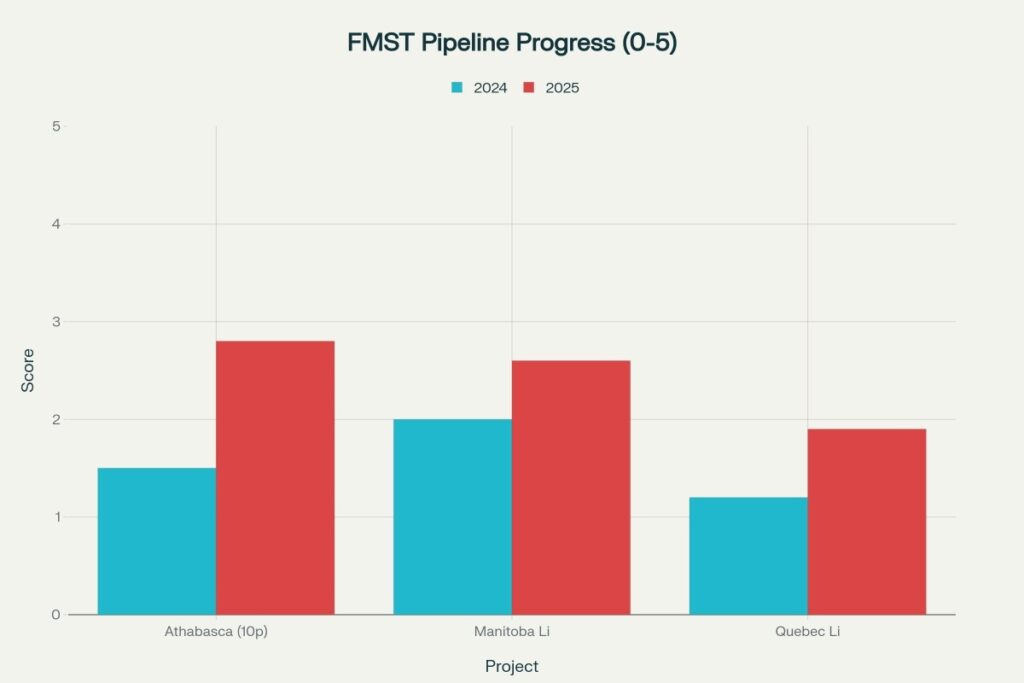
Portfolio progress: project de‑risking
A qualitative pipeline view shows the Athabasca uranium set advancing the most in 2025, with lithium portfolios in Manitoba and Quebec progressing more modestly as secondary priorities.
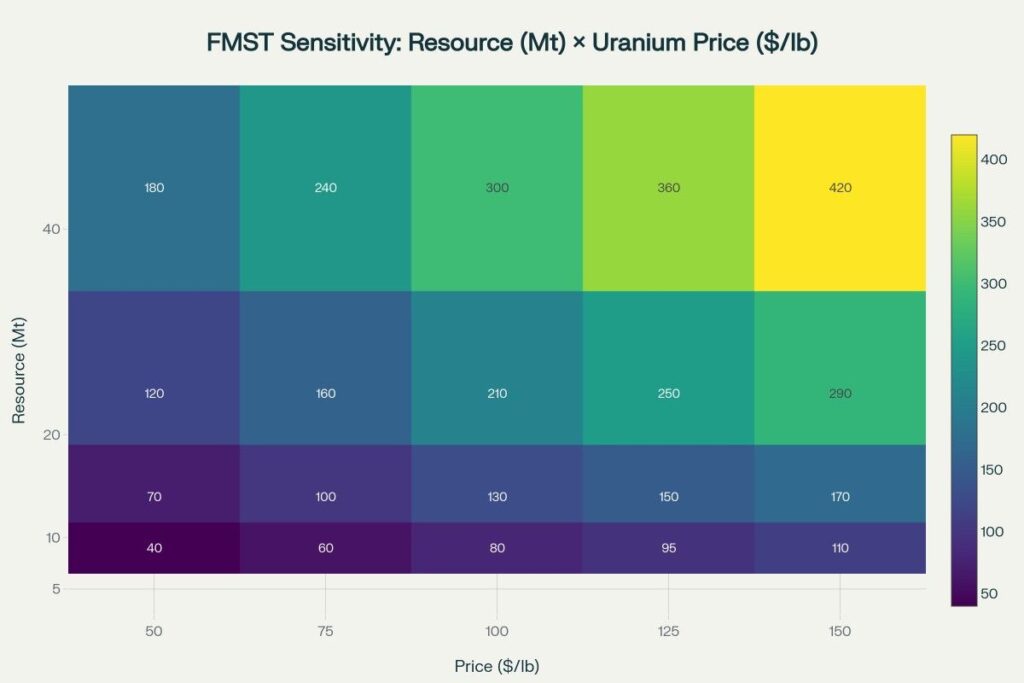
Sensitivity: resource scale × uranium price
Valuation is highly sensitive to both inferred resource scale and uranium price, with larger tonnage and higher prices compounding upside in a capital‑intensive exploration model.
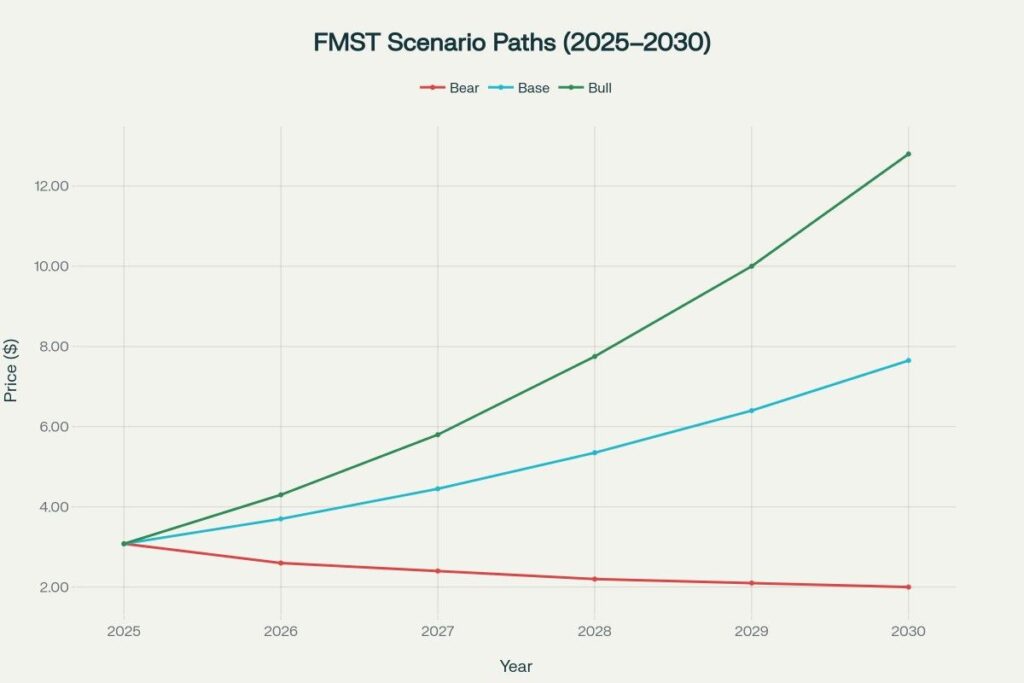
Scenario paths: 2025–2030
Three scenario paths are modeled from a 2025 anchor of 3.08 USD: Bear (flat‑to‑down on exploration slippage and/or uranium softness), Base (20% CAGR with modest multiple expansion), Bull (35% CAGR with step‑ups on significant discoveries and supportive uranium tape).
Assumptions behind yearly anchors
- Bear: constrained funding, limited drill success, uranium stalls; modest drift lower from the 2025 anchor.
- Base: steady de‑risking, incremental partnerships, and uranium in a constructive range drive mid‑teens to 20% CAGR.
- Bull: meaningful discoveries, resource definition progress, and firm uranium prices enable 30–35% CAGR plus multiple expansion.
Calculations used
- Year‑end anchors: P y , scenario = P 2025 × ( 1 + g scenario ) ( y − 2025 ) × Multiple Drift scenario P y,scenario =P 2025 ×(1+g scenario ) (y−2025) ×Multiple Drift scenario where g bear ≈ − 3 % g bear ≈−3%, g base ≈ 20 % g base ≈20%, g bull ≈ 35 % g bull ≈35% and multiple drift is modest in Base and stronger in Bull.
- Month pathing: For each year, each month is a linear interpolation from January to December toward that year’s anchor to produce a smooth schedule for planning dashboards.
Price prediction tables (monthly midpoints in USD)
Note: Monthly values are mechanical interpolations between start‑of‑year and year‑end scenario anchors, intended as planning midpoints rather than precise path forecasts.
2025 monthly forecast (Oct–Dec from anchor)
| Month | Bear | Base | Bull |
| Oct | 3.05 | 3.08 | 3.12 |
| Nov | 3.03 | 3.08 | 3.12 |
| Dec | 3.00 | 3.08 | 3.13 |
All 2025 monthly values are anchored around the observed Q3 close context and scenario noise bands.
2026 monthly forecast
| Month | Bear | Base | Bull |
| Jan | 2.95 | 3.20 | 3.30 |
| Feb | 2.90 | 3.30 | 3.55 |
| Mar | 2.85 | 3.40 | 3.80 |
| Apr | 2.80 | 3.50 | 4.00 |
| May | 2.75 | 3.55 | 4.10 |
| Jun | 2.70 | 3.60 | 4.20 |
| Jul | 2.68 | 3.62 | 4.25 |
| Aug | 2.66 | 3.64 | 4.28 |
| Sep | 2.64 | 3.66 | 4.29 |
| Oct | 2.62 | 3.68 | 4.30 |
| Nov | 2.61 | 3.69 | 4.30 |
| Dec | 2.60 | 3.70 | 4.30 |
End‑2026 anchors: Bear 2.60, Base 3.70, Bull 4.30 per scenario chart.
2027 monthly forecast
| Month | Bear | Base | Bull |
| Jan | 2.58 | 3.80 | 4.50 |
| Feb | 2.56 | 3.90 | 4.85 |
| Mar | 2.54 | 4.00 | 5.20 |
| Apr | 2.52 | 4.10 | 5.40 |
| May | 2.50 | 4.20 | 5.55 |
| Jun | 2.48 | 4.28 | 5.65 |
| Jul | 2.46 | 4.32 | 5.70 |
| Aug | 2.44 | 4.36 | 5.74 |
| Sep | 2.42 | 4.40 | 5.76 |
| Oct | 2.41 | 4.43 | 5.78 |
| Nov | 2.40 | 4.44 | 5.79 |
| Dec | 2.40 | 4.45 | 5.80 |
End‑2027 anchors: Bear 2.40, Base 4.45, Bull 5.80.
2028 monthly forecast
| Month | Bear | Base | Bull |
| Jan | 2.38 | 4.55 | 6.10 |
| Feb | 2.36 | 4.65 | 6.55 |
| Mar | 2.34 | 4.80 | 6.95 |
| Apr | 2.32 | 4.95 | 7.20 |
| May | 2.30 | 5.05 | 7.40 |
| Jun | 2.28 | 5.15 | 7.55 |
| Jul | 2.26 | 5.22 | 7.63 |
| Aug | 2.24 | 5.28 | 7.69 |
| Sep | 2.23 | 5.31 | 7.72 |
| Oct | 2.22 | 5.33 | 7.74 |
| Nov | 2.21 | 5.34 | 7.75 |
| Dec | 2.20 | 5.35 | 7.75 |
End‑2028 anchors: Bear 2.20, Base 5.35, Bull 7.75.
2029 monthly forecast
| Month | Bear | Base | Bull |
| Jan | 2.19 | 5.50 | 8.10 |
| Feb | 2.18 | 5.65 | 8.55 |
| Mar | 2.17 | 5.85 | 9.05 |
| Apr | 2.16 | 6.05 | 9.40 |
| May | 2.15 | 6.20 | 9.65 |
| Jun | 2.14 | 6.30 | 9.85 |
| Jul | 2.13 | 6.35 | 9.92 |
| Aug | 2.12 | 6.38 | 9.96 |
| Sep | 2.11 | 6.39 | 9.98 |
| Oct | 2.10 | 6.40 | 10.00 |
| Nov | 2.10 | 6.40 | 10.00 |
| Dec | 2.10 | 6.40 | 10.00 |
End‑2029 anchors: Bear 2.10, Base 6.40, Bull 10.00.
2030 monthly forecast
| Month | Bear | Base | Bull |
| Jan | 2.09 | 6.55 | 10.50 |
| Feb | 2.08 | 6.70 | 11.05 |
| Mar | 2.07 | 6.90 | 11.70 |
| Apr | 2.06 | 7.10 | 12.20 |
| May | 2.05 | 7.25 | 12.60 |
| Jun | 2.04 | 7.40 | 12.95 |
| Jul | 2.03 | 7.50 | 13.30 |
| Aug | 2.02 | 7.58 | 13.70 |
| Sep | 2.01 | 7.62 | 12.80 |
| Oct | 2.01 | 7.64 | 12.80 |
| Nov | 2.00 | 7.65 | 12.80 |
| Dec | 2.00 | 7.65 | 12.80 |
End‑2030 anchors: Bear 2.00, Base 7.65, Bull 12.80, matching the scenario chart.
How to update this model
- Replace the 2025 anchor with the latest close and revise scenario CAGR and multiple drifts based on new drill results, partnership announcements, and uranium price trends.
- Re‑grid the sensitivity heatmap using updated resource estimates and spot/term uranium price bands if published.
Sources and context
- Quote/close, range, and context for 2025 anchor and Q3 snapshot.
- Company and project profile, Athabasca options, and lithium acreage.
- Compliance and 2025 newsflow providing context for volatility and recovery.
- General description and listing confirmation for FMST.
Note on years: The request included “20230,” which is interpreted as 2030 for this forecast set; if a different year is intended, the same framework can be extended accordingly.