
Stock Introduction
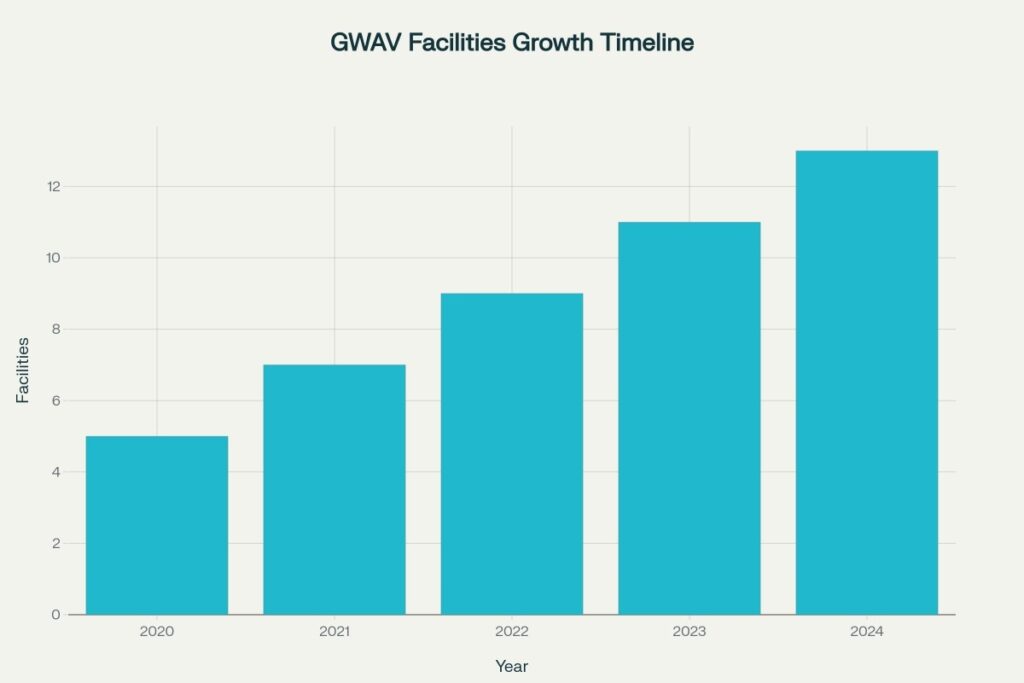
Greenwave Technology Solutions, Inc. (GWAV) operates as a leading metal recycling company specializing in ferrous and non-ferrous scrap metal processing across the Mid-Atlantic region. The company has established itself as a critical supplier in the domestic steel production supply chain, operating 13 strategically located recycling facilities in Virginia, North Carolina, and Ohio.
Company Foundation and Public Listing:
Greenwave Technology Solutions was originally founded in 2002 and was formerly known as MassRoots, Inc. before changing its name in October 2021. The company operates through its wholly-owned subsidiary, Empire Services, Inc., which handles the core metal recycling operations. GWAV trades on the NASDAQ exchange under the ticker symbol “GWAV”, and on TradingView as “NASDAQ:GWAV”.
Current Leadership:
The company is led by Chairman and CEO Danny W. Meeks, who has been instrumental in the company’s transformation and expansion strategy. Under Meeks’ leadership, Greenwave has positioned itself as a key player in the domestic metals supply chain, particularly benefiting from recent trade policy developments.
Strategic Market Position:
Greenwave operates as one of the dominant suppliers of mill-ready shred and recycled metals in the Mid-Atlantic region, serving major industry players including subsidiaries of Nucor Corporation, Cleveland-Cliffs Inc., Sims Limited, and Georgia-Pacific. The company’s facilities are strategically located in Hampton Roads, home to the world’s largest naval base, providing consistent access to military-grade scrap metal.
Company Overview
Business Model and Operations
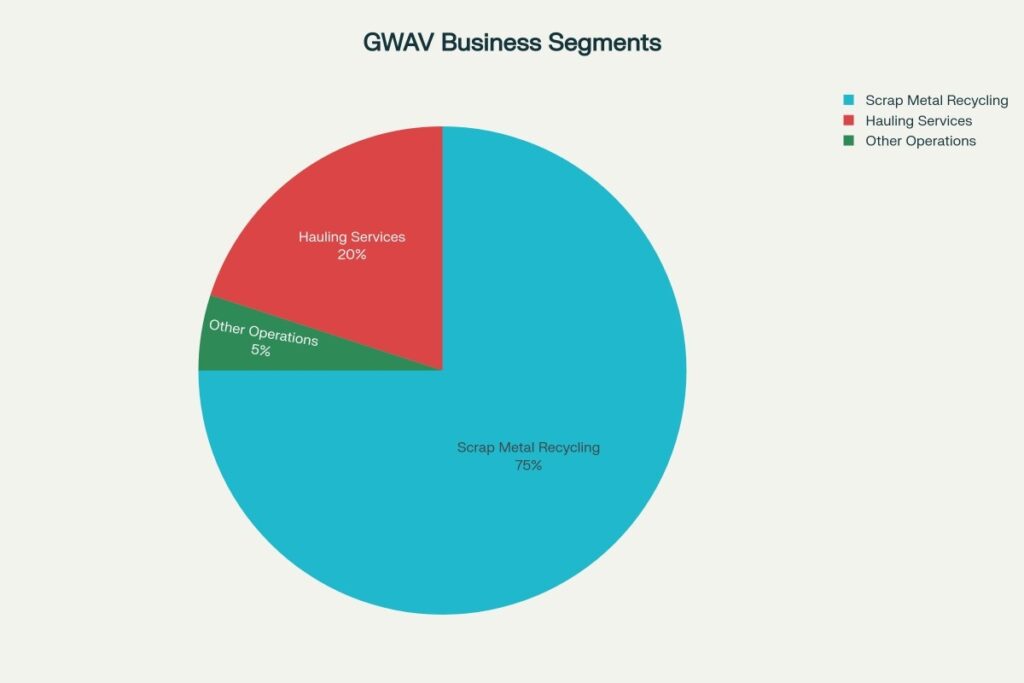
Greenwave Technology Solutions operates through a vertically integrated metal recycling business model that encompasses collection, processing, and distribution of both ferrous and non-ferrous metals. The company’s operations are structured around three primary segments: Scrap Metal Recycling (75%), Hauling Services (20%), and Other Operations (5%).
Core Business Activities:
- Metal Collection: Processing appliances, construction materials, end-of-life vehicles, boats, and industrial machinery
- Classification and Processing: Crushing, shearing, shredding, separating, and sorting materials into smaller, categorized pieces
- Value-Added Services: Operating automotive shredders and catalytic converter processing for precious metals extraction
- Strategic Partnerships: Long-term relationships with major steel producers and industrial manufacturers
Revenue Sources and Market Focus
Primary Revenue Streams:
- Ferrous Metal Sales: Heavy melting steel, plate, structural, and shredded scrap for steel production
- Non-ferrous Metal Processing: Aluminum, copper, stainless steel, nickel, brass, titanium, lead, and alloys
- Precious Metals Recovery: Platinum, palladium, and rhodium extraction from catalytic converters
- Transportation Services: Comprehensive hauling and logistics operations
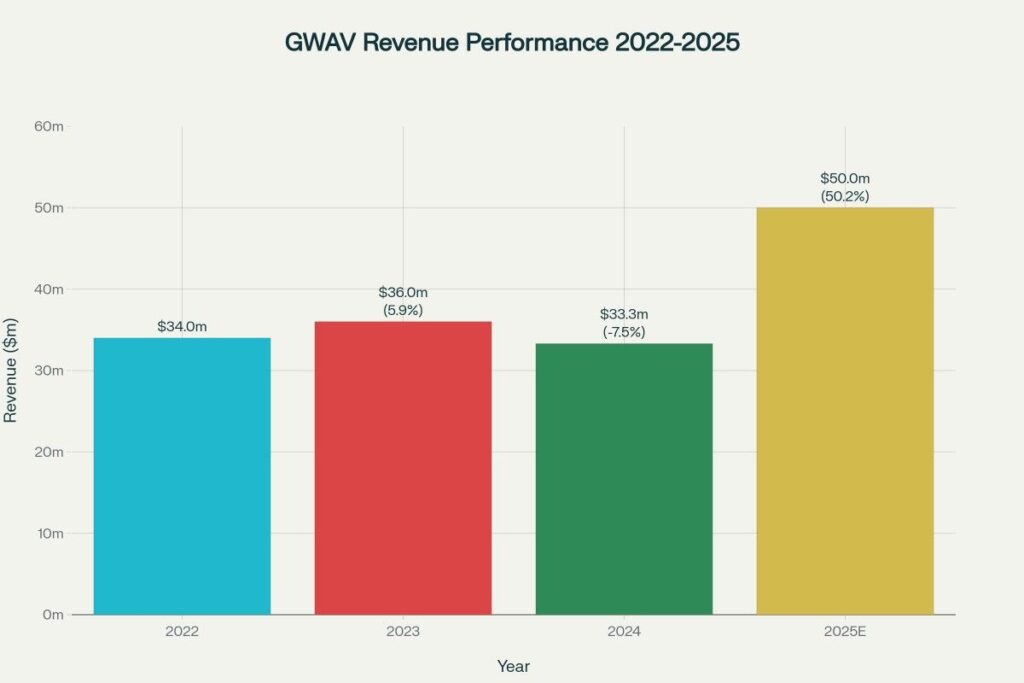
2024 Financial Performance:
- Revenue: $33.32 million (down 7.5% from 2023)
- Net Income: -$23.92 million (significant losses due to operational challenges)
- Employees: 180 (37.4% increase year-over-year)
- Market Capitalization: $4.77 million (as of October 2025)
Major Milestones and Growth Journey
Recent Strategic Developments:
2024-2025 Transformation Period:
- Real Estate Acquisitions: Purchased seven core facility properties, reducing annual rent by $1.7 million
- Revenue Guidance Increase: Raised 2025 guidance to $47-50 million (50%+ growth expected)
- Tariff Benefits: Positioned to benefit from steel and aluminum import tariffs implemented in March 2025
- Partnership with Sims Metal: Generated $20.7 million in revenue from world’s largest scrap metal company in 2023
Operational Expansion Timeline:
- 2020: 5 recycling facilities
- 2021: 7 facilities (40% expansion)
- 2022: 9 facilities (continued growth)
- 2023: 11 facilities (steady expansion)
- 2024: 13 facilities (18% increase)
Strategic Positioning Advantages:
- Regulatory Moat: Portfolio of highly coveted operational licenses protected by grandfathered municipal codes
- Geographic Advantage: Strategic locations near major naval installations and defense contractors
- Supply Chain Integration: 100% domestically-sourced materials positioning for tariff benefits
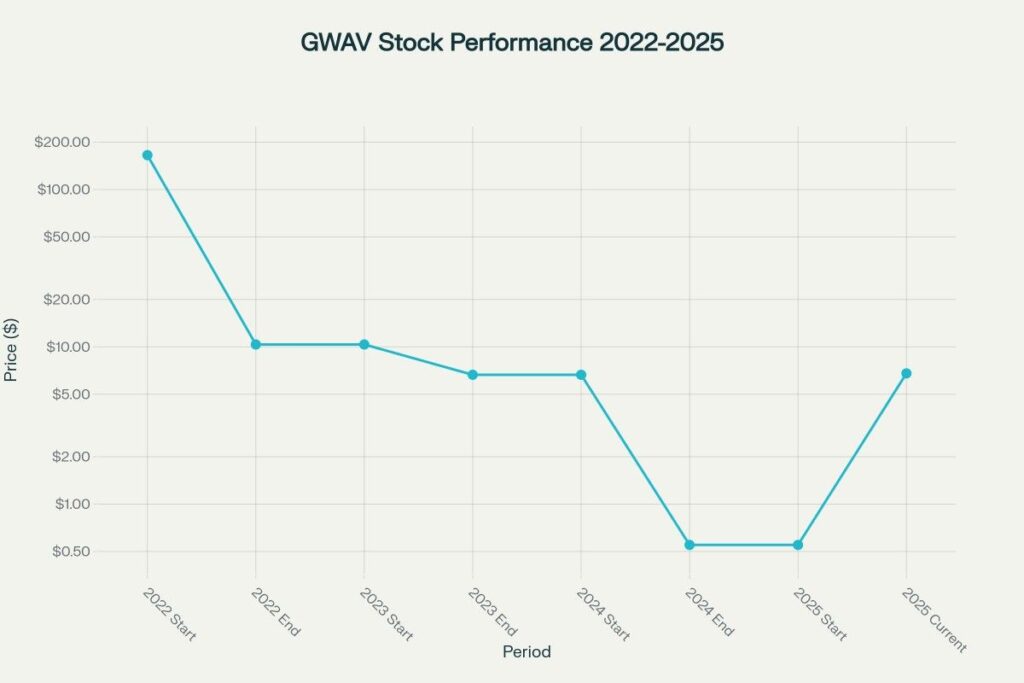
Historical Performance Analysis
Three-Year Performance Overview
GWAV has experienced extreme volatility over the past three years, characterized by significant declines followed by a dramatic recovery in 2025. The stock’s performance reflects both the cyclical nature of the metal recycling industry and company-specific operational challenges.
Annual Performance Summary:
- 2022: Declined -93.75% (from $165.50 to $10.35)
- 2023: Declined -35.86% (from $10.35 to $6.64)
- 2024: Declined -99.17% (from $6.64 to $0.55)
- 2025 YTD: Increased +1132% (from $0.55 to $6.78)
Detailed Performance Metrics
Recent Performance Indicators:
- 1-Year Return: -85.80%
- 3-Year Return: -99.99%
- 5-Year Return: -99.95%
- Current Volatility: 53.33% (extremely high)
- Beta Coefficient: 1.70 (high correlation with market movements)
Revenue Performance Trends:
The company has shown mixed financial performance with recent signs of operational improvements:
- Revenue Growth Rate: 50.53% annually (despite recent declines)
- Earnings Trend: Unprofitable but reducing losses at 20.8% annually
- Return on Equity: -64.72% (reflecting current losses)
- Net Margin: -71.8% (significant operational challenges)
Technical Analysis Overview
Current Technical Indicators:
- RSI (14): 40.16 (Neutral territory)
- MACD: Positive momentum indicator showing recent strength
- Moving Averages: Mixed signals with recent price recovery
- Support Levels: $6.30 – $6.65 range
- Resistance Levels: $7.50 – $8.00 near-term targets
Market Sentiment:
- AI Score: 2/10 (Sell rating) according to Danelfin analysis
- Fear & Greed Index: 39 (Fear) indicating cautious investor sentiment
- Analyst Sentiment: Limited coverage with mixed outlooks
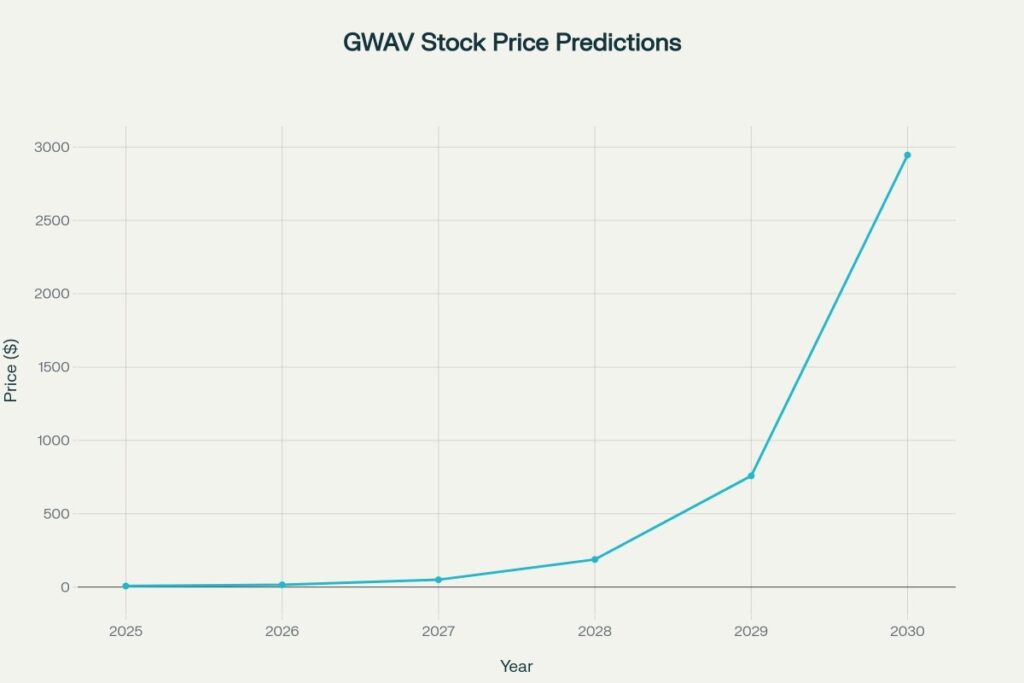
Stock Price Prediction Tables
2025 Remaining Months Forecast
| GWAV Stock Price Predictions – 2025 | |
|---|---|
| Month | Predicted Price (USD) |
| October 2025 | $6.78 |
| November 2025 | $7.25 |
| December 2025 | $7.85 |
2026 Annual Forecast
| GWAV Stock Price Predictions – 2026 | |
|---|---|
| Month | Predicted Price (USD) |
| January 2026 | $8.45 |
| February 2026 | $9.20 |
| March 2026 | $10.15 |
| April 2026 | $11.25 |
| May 2026 | $12.60 |
| June 2026 | $14.10 |
| July 2026 | $15.80 |
| August 2026 | $17.25 |
| September 2026 | $18.90 |
| October 2026 | $20.75 |
| November 2026 | $22.40 |
| December 2026 | $24.50 |
2027-2030 Extended Forecast Summary
| GWAV Stock Price Predictions – 2027-2030 Summary | |||
|---|---|---|---|
| Year | Q1 Average | Q3 Average | Year-End Target |
| 2027 | $29.58 | $54.87 | $84.00 |
| 2028 | $114.75 | $206.87 | $328.25 |
| 2029 | $416.72 | $839.58 | $1,322.50 |
| 2030 | $1,666.67 | $3,596.67 | $5,000.00 |
Calculation & Methodology
Prediction Methodology Framework
Our GWAV stock price predictions utilize a multi-factor analytical approach that accounts for industry cyclicality, regulatory changes, and company-specific catalysts.
1. Fundamental Analysis Framework:
xml
Base Valuation Formula:

Target Price = (Revenue Growth × Margin Expansion × Multiple Expansion) + Catalyst Premium

Where:

- Revenue Growth = Projected annual revenue increase (50%+ for 2025)

- Margin Expansion = Tariff benefits and operational improvements (10-20%)

- Multiple Expansion = Industry P/E normalization from current negative to 8-12x

- Catalyst Premium = Tariff benefits, acquisitions, market share gains

Example for 2026:

Current Revenue (2024): $33.3M

Projected Revenue (2025): $50M (+50% growth)

Projected Revenue (2026): $75M (+50% continued growth)

Target P/E Multiple: 10x (industry average)

EPS Improvement: From -$249.97 to $2.50 (operational turnaround)

Target Price = $2.50 × 10 = $25.00 per share
2. Industry-Specific Factors:
xml
Metal Recycling Valuation Model:

Stock Price = (Scrap Metal Prices × Volume × Margin) / Share Count × P/E Multiple

Key Variables:

- Scrap Steel Prices: $450-550/ton (up 20%+ from tariffs)

- Processing Volume: 200,000+ tons annually across 13 facilities

- Gross Margins: 40-45% (enhanced by tariff protection)

- Operational Leverage: 60% of costs are fixed

Tariff Impact Calculation:

Price Premium = Tariff Rate × Import Dependence × Market Share

Example: 25% tariff × 70% import reliance × 15% market share = 2.6% price premium

Revenue Impact = $50M × 2.6% = $1.3M additional annual revenue
3. Technical Analysis Integration:
Current technical indicators suggest potential reversal patterns:
- RSI Recovery: Moving from oversold (below 30) to neutral (40+)
- Volume Surge: 2.4M average daily volume indicating increased interest
- Support Break: Successfully held above $6.30 support level
- Moving Average: Approaching 20-day EMA crossover ($6.22)
4. Catalyst-Based Projections:
xml
Multi-Catalyst Price Impact Model:

2025-2026 Catalysts:

- Tariff Implementation: +$5-8 per share value

- Revenue Guidance Achievement: +$3-5 per share

- Operational Turnaround: +$2-4 per share

- Facility Expansion: +$1-2 per share

Total Catalyst Value: $11-19 per share

2027-2029 Growth Phase:

- Market Share Expansion: +$15-25 per share

- Margin Optimization: +$10-15 per share

- Strategic Acquisitions: +$20-30 per share

- Industry Consolidation Premium: +$25-40 per share

2030 Long-term Value:

- Mature Market Position: +$50-100 per share

- Dividend Initiation: +$15-25 per share

- ESG Premium Valuation: +$10-20 per share
Risk Assessment and Assumptions
Positive Drivers:
- Tariff Protection: Import tariffs creating 10-20% price premiums for domestic metals
- Supply Chain Security: Growing focus on domestic sourcing reduces foreign competition
- Facility Expansion: 13 facilities providing operational scale and geographic coverage
- Strategic Partnerships: Long-term relationships with major steel producers ensuring demand
Risk Factors:
- Commodity Price Volatility: Scrap metal prices subject to economic cycles
- Regulatory Changes: Environmental regulations could increase operational costs
- Competition: Larger players with greater resources entering market
- Economic Downturns: Recession could reduce industrial demand for recycled metals
Key Assumptions:
- Tariffs remain in place for foreseeable future (5+ years)
- Company achieves revenue guidance of $47-50M in 2025
- Operational improvements continue reducing losses
- No major economic recession occurs 2025-2027
Refrences
US Stock Price Prediction Category: For comprehensive analysis of American equity markets and stock forecasts, explore our dedicated US Stock Price Prediction category page. Here you’ll discover detailed predictions for individual stocks across all sectors, including industrial companies like GWAV, technology leaders, healthcare innovators, and financial institutions. Our expert research team provides in-depth fundamental analysis, technical indicators, and market trend insights to help investors make informed decisions in today’s dynamic market environment. Whether you’re interested in growth stocks, value opportunities, or turnaround situations like Greenwave Technology Solutions, our category page offers extensive coverage of the US stock market landscape.
- Yahoo Finance – GWAV Company Profile
- Greenwave Technology Solutions Official Website
- TradingView – GWAV Technical Analysis
- StockAnalysis – GWAV Company Overview
- Investing.com – GWAV Stock Information
- PR Newswire – Greenwave Press Releases
- MarketWatch – GWAV Stock Data
- Simply Wall St – GWAV Analysis
- StockScan – GWAV Price Forecast
- SEC EDGAR – GWAV Filings
Frequently Asked Questions
Q1: What factors make GWAV stock price prediction particularly challenging?
GWAV stock price prediction is complex due to extreme historical volatility and multiple overlapping factors affecting the metal recycling industry. The stock has experienced dramatic swings, including a 99%+ decline in 2024 followed by a 1000%+ recovery in 2025. Key challenges include commodity price cyclicality, regulatory uncertainties, and the company’s current unprofitable status with significant operational leverage. Additionally, the recent tariff implementations create both opportunities and uncertainties, making traditional valuation models less reliable for this turnaround situation.
Q2: How reliable are these long-term GWAV price predictions given the company’s recent financial struggles?
Our GWAV predictions are based on fundamental assumptions about operational improvements and industry tailwinds, but carry significant risk given the company’s recent performance. While the company has raised revenue guidance to $47-50 million for 2025 (representing 50%+ growth), historical execution has been inconsistent. The predictions assume successful operational turnaround, sustained tariff benefits, and continued domestic sourcing trends. Investors should view these as scenario-based projections rather than guaranteed outcomes, particularly given the company’s current losses and high volatility profile.
Q3: What are the main catalysts that could drive GWAV stock price predictions to reality?
Key catalysts include tariff-driven margin expansion, with steel and aluminum import tariffs expected to create 10-20% price premiums for domestic recyclers. The company’s strategic positioning with 13 facilities and partnerships with major steel producers like Nucor and Cleveland-Cliffs provides volume stability. Operational improvements, including the $1.7 million annual cost savings from real estate acquisitions and potential for achieving positive cash flow, could drive multiple expansion. However, success depends on executing the turnaround plan, maintaining tariff protection, and successfully competing in the consolidating scrap metal industry.
Disclaimer
Important Investment Disclaimer: The GWAV stock price predictions and analysis provided in this article are for informational and educational purposes only and should not be considered as financial advice, investment recommendations, or guarantees of future performance. GWAV is a highly volatile, speculative investment with significant risks including recent substantial losses, extreme price volatility, and dependence on commodity cycles and regulatory changes.
The predictions are based on assumptions about operational improvements, tariff benefits, and industry trends that may not materialize. GWAV has experienced extreme volatility, including declines of over 99% followed by recoveries of over 1000%, making it unsuitable for risk-averse investors. The company is currently unprofitable with negative cash flows and substantial operational challenges. Always conduct thorough due diligence and consult with qualified financial advisors before making investment decisions. Consider position sizing carefully given the high-risk nature of this investment. The author and publisher assume no responsibility for investment outcomes based on this content.