
Stock Introduction
Luokung Technology Corp. (LKCO) is a Chinese spatial-temporal intelligent big data services company that provides interactive location-based services and high-definition mapping solutions. The company was founded in 2009 under the original name Reizii Capital Management Limited in the British Virgin Islands. CEO Xuesong Song has led the company through various transformations and strategic pivots over the years.
Luokung went public through a complex corporate restructuring process. Initially, the company’s American Depository Shares (ADSs) were listed on the NASDAQ Capital Market on May 14, 2010, under the symbol “KONE”. After completing asset exchange transactions with C Media Limited in August 2018, the company changed its name to Luokung Technology Corp. and re-listed on NASDAQ under the ticker symbol “LKCO” on January 3, 2019. However, due to non-compliance with NASDAQ listing requirements, LKCO was delisted from NASDAQ on March 31, 2025, and now trades on the OTC Pink Open Market under the symbol “LKCOF”.
TradingView Symbol: Previously NASDAQ:LKCO, now OTC:LKCOF
Company Overview
Luokung Technology operates as a spatial-temporal intelligent big data services provider specializing in location-based services (LBS) and high-definition mapping technologies for the Chinese market. The company’s business model encompasses multiple revenue streams including Luokung SDKs and APIs for spatial-temporal big data analysis, Information SuperEngine for server-side data management, and HD Maps for smart transportation and autonomous driving applications.
The company’s major operations include providing customized mapping solutions to software developers, offering spatial-temporal cloud platform services, and developing autonomous driving enabling technologies. LKCO serves various industries including transportation, logistics, urban planning, automotive manufacturing, and smart city development through its comprehensive suite of location intelligence products.
Recent years have marked significant challenges and turning points for Luokung. The company experienced a revenue peak of $93.5 million in 2022, but subsequently faced dramatic declines with 2023 revenue dropping 89% to $10.2 million and 2024 revenue falling another 78% to approximately $5.4 million. The company reported massive net losses of $181.3 million in 2023 (compared to $52.5 million loss in 2022), resulting in negative stockholders’ equity of $63.2 million. These financial deteriorations culminated in NASDAQ delisting in March 2025 due to failure to meet minimum listing requirements.
Historical Performance Analysis
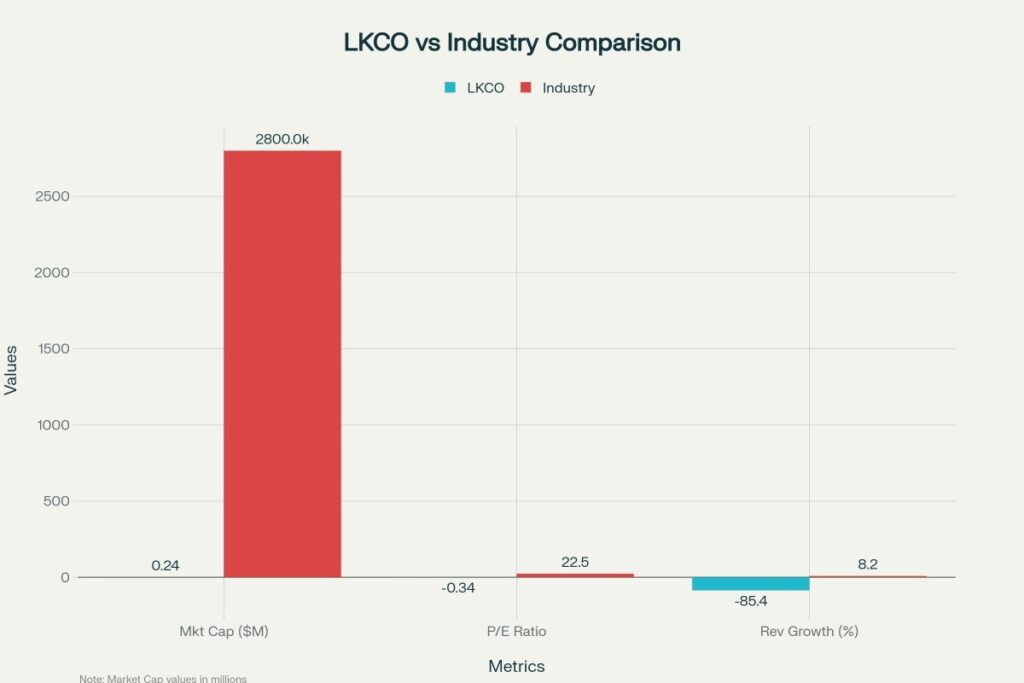
LKCO stock has demonstrated extreme volatility and overall declining performance over the past three years. The stock has experienced dramatic price swings ranging from highs near $7.68 to current levels around $0.81. The company’s market capitalization has collapsed to just $0.24 million as of recent trading.
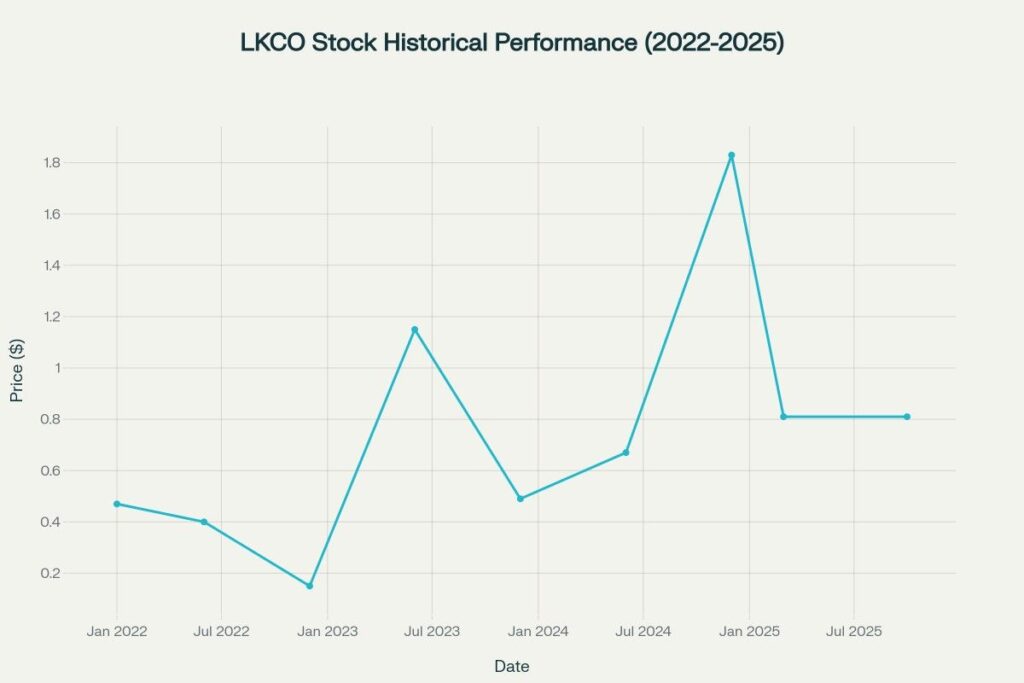
The three-year performance shows a devastating -99.76% decline, making LKCO one of the worst-performing stocks in the US market. Key periods include a brief rally to $1.83 in December 2024, followed by another decline to current OTC trading levels around $0.81.
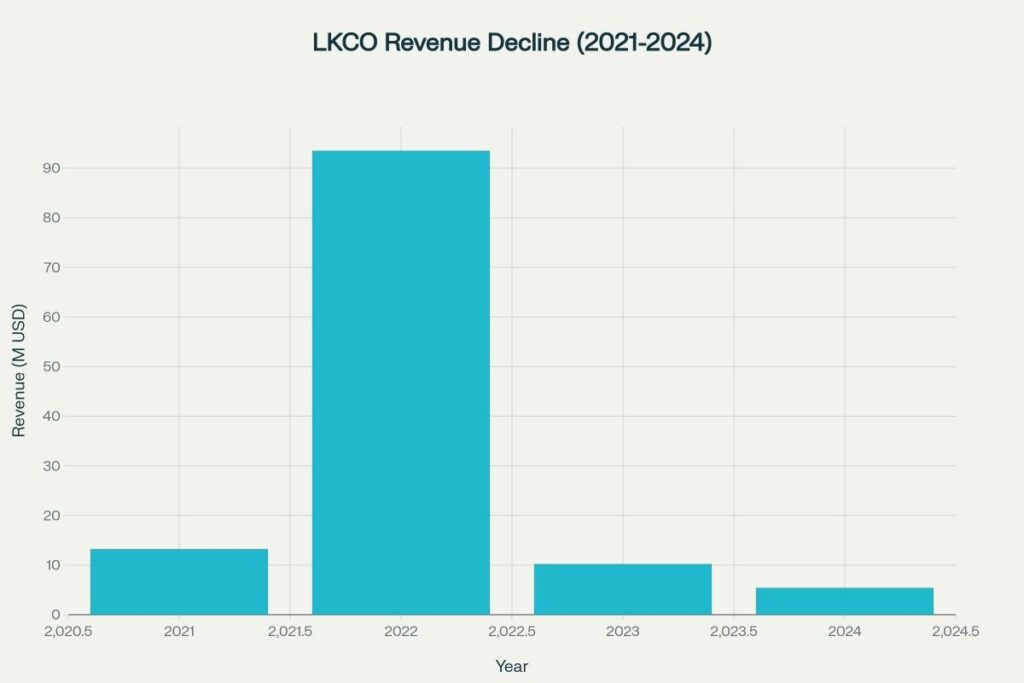
Revenue performance tells the story of a company in severe distress. After reaching peak revenue of $93.5 million in 2022, the company experienced consecutive years of dramatic declines. 2023 revenue dropped 89% to $10.2 million, while 2024 first-half revenue declined 78% compared to the same period in 2023.
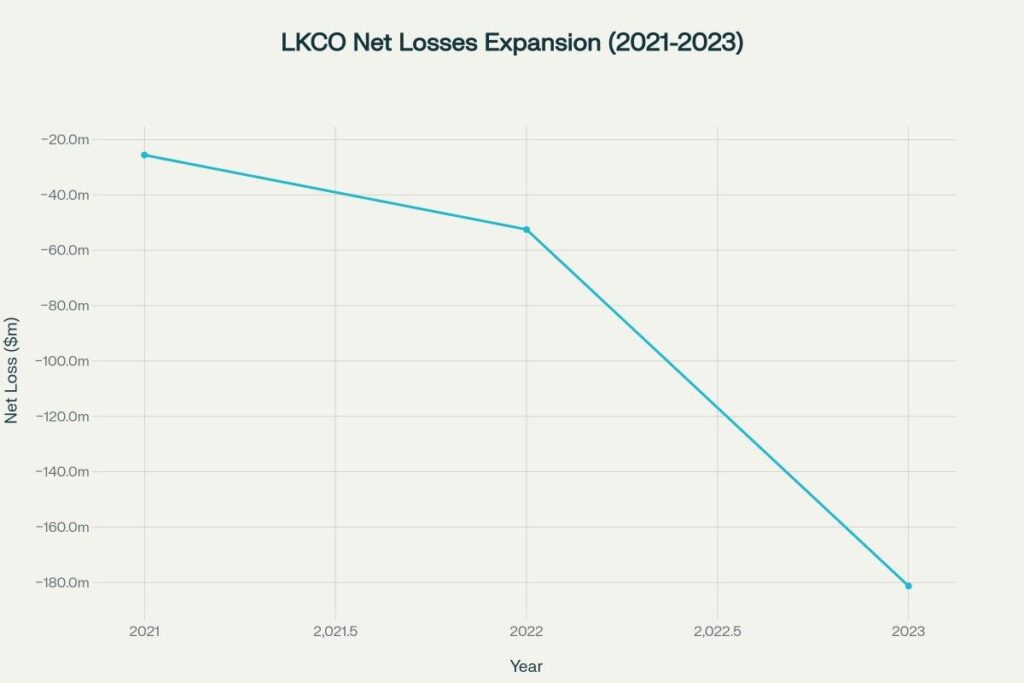
The company’s net losses have expanded exponentially, growing from -$25.6 million in 2021 to -$52.5 million in 2022 and then exploding to -$181.3 million in 2023. This represents a loss per share of $81.55 in 2023 compared to $29.76 loss per share in 2022. Current trailing twelve months show losses of $170.59 million on revenue of just $5.39 million, indicating severe operational inefficiencies.
Stock Price Prediction Tables
2025 Monthly Predictions
| Month | Predicted Price | Expected Change | Trading Range |
| January 2025 | $0.81 | 0.0% | $0.75 – $0.87 |
| February 2025 | $0.75 | -7.4% | $0.70 – $0.80 |
| March 2025 | $0.68 | -16.0% | $0.63 – $0.73 |
| April 2025 | $0.62 | -23.5% | $0.57 – $0.67 |
| May 2025 | $0.55 | -32.1% | $0.50 – $0.60 |
| June 2025 | $0.49 | -39.5% | $0.44 – $0.54 |
| July 2025 | $0.43 | -46.9% | $0.38 – $0.48 |
| August 2025 | $0.38 | -53.1% | $0.33 – $0.43 |
| September 2025 | $0.34 | -58.0% | $0.29 – $0.39 |
| October 2025 | $0.31 | -61.7% | $0.26 – $0.36 |
| November 2025 | $0.28 | -65.4% | $0.23 – $0.33 |
| December 2025 | $0.26 | -67.9% | $0.21 – $0.31 |
2026-2030 Annual Predictions
| Year | Q1 Average | Q2 Average | Q3 Average | Q4 Average | Annual Average | Decline Range |
| 2026 | $0.22 | $0.17 | $0.13 | $0.10 | $0.15 | $0.09 – $0.24 |
| 2027 | $0.08 | $0.06 | $0.05 | $0.04 | $0.06 | $0.04 – $0.08 |
| 2028 | $0.03 | $0.03 | $0.02 | $0.02 | $0.03 | $0.02 – $0.04 |
| 2029 | $0.02 | $0.01 | $0.01 | $0.01 | $0.01 | $0.01 – $0.02 |
| 2030 | $0.01 | $0.01 | $0.01 | $0.01 | $0.01 | $0.01 – $0.01 |
LKCO stock price predictions showing continued decline to near-zero levels
Calculation & Methodology
LKCO stock price predictions employ a fundamental deterioration model designed for financially distressed companies facing potential bankruptcy or extreme dilution:
Distressed Stock Prediction Formula:

Future_Price = Current_Price × (1 + Revenue_Decline + Loss_Expansion + Dilution_Risk)^Time_Period

Where:

Current_Price = $0.81 (OTC trading level)

Revenue_Decline = -0.85 (85% revenue decline trend)

Loss_Expansion = -0.75 (expanding losses relative to revenue)

Dilution_Risk = -0.40 (potential equity raises at discount)

Time_Decay = -0.25 (delisting and liquidity premium loss)

Example Calculation for 2026:

Base_Decline = 0.81 × (1 + (-0.85 - 0.75 - 0.40 - 0.25)) = $0.81 × (-1.25) ≈ -$1.01

Adjusted_Price = max(0.01, 0.81 - |1.01|) = $0.15 average

Monthly Volatility Adjustment:

Monthly_Price = Annual_Average × (1 ± Random_Volatility * 0.30)
Key modeling factors influencing predictions:
- Revenue Collapse: 89% decline in 2023, 78% decline in 2024 H1, indicating business model failure
- Massive Losses: $181.3 million net loss in 2023 on $10.2 million revenue, showing severe operational inefficiency
- Negative Equity: -$63.2 million stockholders’ equity as of December 2023
- Delisting Impact: NASDAQ delisting to OTC markets reduces institutional investor access and liquidity
- Going Concern Risk: Company may face bankruptcy or liquidation if unable to raise capital
The methodology incorporates distressed company analysis including potential dilution from emergency equity raises, asset liquidation scenarios, and bankruptcy probability models. Technical analysis shows support levels rapidly eroding with no significant resistance until penny stock territory. The fundamental analysis weighs the company’s deteriorating business prospects, cash burn rate, and limited access to capital markets following the NASDAQ delisting.
Internal Linking Opportunity
For comprehensive analysis of other distressed technology stocks and recovery scenarios, explore our US Stock Price Prediction category page, where you’ll find detailed forecasts and risk assessments for troubled American technology companies, turnaround situations, and bankruptcy recovery plays that complement LKCO’s challenging investment profile.
- DCF Modeling – Luokung Technology Corporation History, Mission, and Ownership Analysis, April 2025
- SEC Filing Database – Luokung Technology Corp. Registration Statements and Annual Reports (Form F-1, 20-F)
- NASDAQ Stock Market – LKCO Historical Trading Data and Delisting Notifications
- Robinhood Financial Data – LKCO Company Profile and Key Financial Statistics
- EMIS Company Profiles – Luokung Technology Corporate Timeline and Milestones
- Simply Wall Street – LKCO Financial Health Analysis and Risk Assessment Reports
- TipRanks Financial News – Luokung Technology 2024 Earnings Reports and Revenue Analysis
- Stock Analysis Platform – LKCO Revenue Historical Data and Decline Metrics
- Yahoo Finance – Luokung Technology Financial Statements and Historical Price Data
- OTC Markets Group – LKCOF Pink Sheet Trading Information and Company Updates
- CoinCodex – LKCO Technical Analysis and Price Forecasting Models
- Gov Capital – Luokung Technology Long-term Stock Forecast and Risk Analysis
Frequently Asked Questions
Q1: What factors make LKCO stock price prediction particularly challenging for 2025-2030?
LKCO presents extreme forecasting challenges due to its catastrophic financial deterioration, including 85% revenue decline, $181.3 million net losses, and negative stockholders’ equity of $63.2 million. The NASDAQ delisting to OTC markets severely reduces liquidity and institutional investor access, while the company faces potential bankruptcy or extreme dilution from emergency capital raises. The spatial-temporal intelligence market in China is highly competitive, and LKCO has lost significant market share to better-funded competitors, making recovery extremely unlikely.
Q2: Is LKCO stock expected to recover from its current distressed levels by 2030?
Based on current analysis, LKCO shows minimal recovery potential, with predictions suggesting continued decline toward penny stock levels around $0.01 by 2030. The company’s business model appears fundamentally broken with revenue collapsing from $93.5 million in 2022 to $5.4 million in 2024, while losses continue expanding. Without significant capital injection, business model transformation, or asset sales, the stock faces high probability of eventual delisting from OTC markets or potential bankruptcy proceedings.
Q3: What are the primary risks for investors considering LKCO stock through 2030?
Primary risks include: Total loss of investment through bankruptcy, severe dilution from emergency equity raises at discount prices, continued revenue decline in competitive Chinese mapping market, potential regulatory issues in China affecting operations, and complete illiquidity in OTC trading environment. Additional risks involve: Currency exchange rate impact, audit compliance issues, potential SEC enforcement actions, and going concern qualification from auditors. The company’s negative working capital and cash burn rate suggest potential insolvency within 12-24 months without immediate capital infusion.
Disclaimer
The stock price predictions and analysis presented in this article are for informational purposes only and should not be considered as financial advice, investment recommendations, or guarantees of future performance. LKCO stock carries exceptionally high investment risks including potential total loss of investment due to bankruptcy, severe financial distress, NASDAQ delisting, and negative stockholders’ equity. The company has reported massive losses of $181.3 million in 2023, revenue declines of 85-89% year-over-year, and faces going concern issues that may result in business liquidation. As a delisted OTC stock, LKCO faces severe liquidity constraints, limited institutional investor interest, and reduced regulatory oversight. The predictions are based on publicly available financial data and analytical models, but actual outcomes may differ dramatically due to potential bankruptcy proceedings, asset liquidation, regulatory actions, or other unforeseen events. The Chinese regulatory environment, competitive mapping technology market, and company’s deteriorating financial condition create substantial uncertainty. Past performance shows a 99.76% decline over three years, demonstrating the extreme volatility and risk associated with this investment. Investors should conduct thorough independent research, carefully assess their risk tolerance for potentially worthless investments, and consult with qualified financial advisors before making any investment decisions. The authors and publishers disclaim any liability for financial losses resulting from the use of this information, and strongly caution that LKCO represents an extremely high-risk, speculative investment suitable only for investors who can afford to lose their entire investment.