

Richtech Robotics (NASDAQ: RR) operates in service automation robotics with a small revenue base, negative profitability, and high trading volatility that drives pronounced upswings and drawdowns. Multi‑year projections here are model-based scenarios anchored to current price, recent 52‑week ranges, and revenue trends, not broker targets, with wide bands reflecting micro-cap risk.
Company snapshot
- Ticker: RR (NASDAQ), Class B common stock, used as the basis for pricing in this analysis.
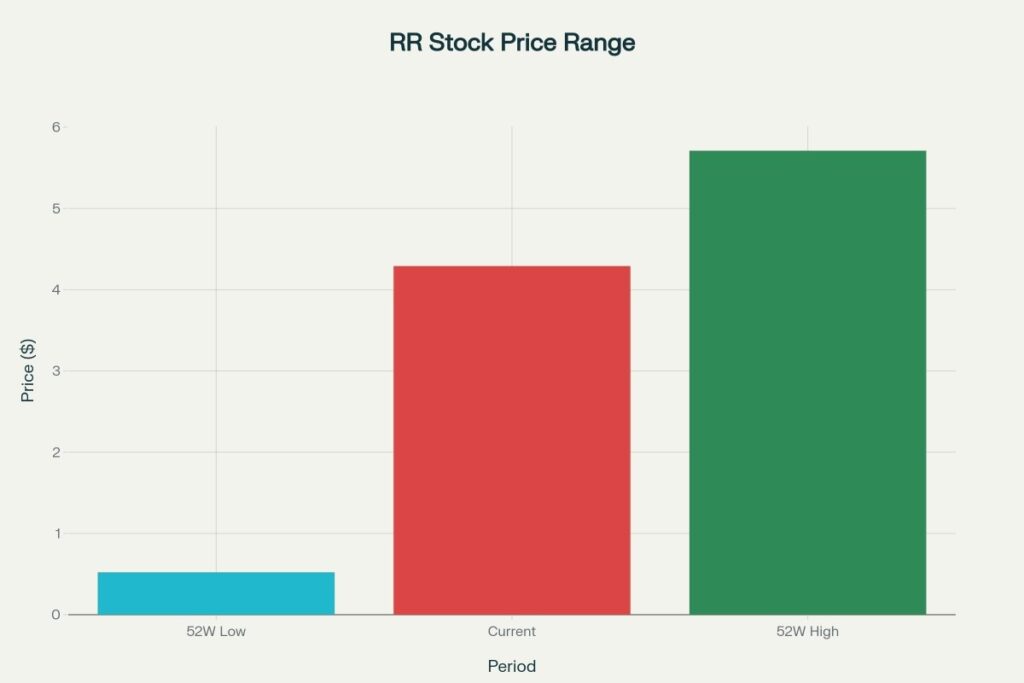
- Recent price context: current ~$4.29, 52‑week low ~$0.52 and high ~$5.71, highlighting extreme range and sentiment sensitivity.
- Revenue scale: TTM revenue ~$4.13M, down ~55% YoY; FY2024 revenue $4.24M versus $8.76M in FY2023, indicating a steep reset.
Growth and downfall drivers
- Growth: product pipeline and contracts in service robotics could enable episodes of rapid repricing from a low base if commercialization improves.
- Downfall: persistent negative operating leverage and small revenue base constrain fundamentals; volatility and thin float amplify drawdowns.
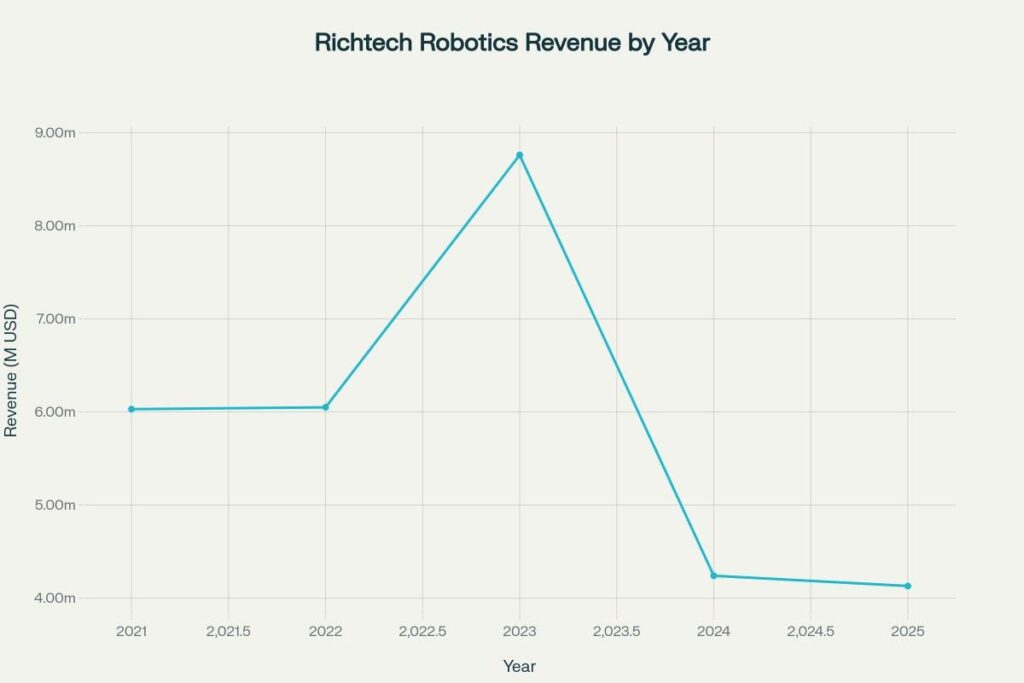
Revenue level (FY) and trend
The revenue history shows FY2021 $6.03M, FY2022 $6.05M, FY2023 $8.76M, FY2024 $4.24M, with TTM at ~$4.13M, illustrating both a 2023 expansion and a 2024–2025 contraction.
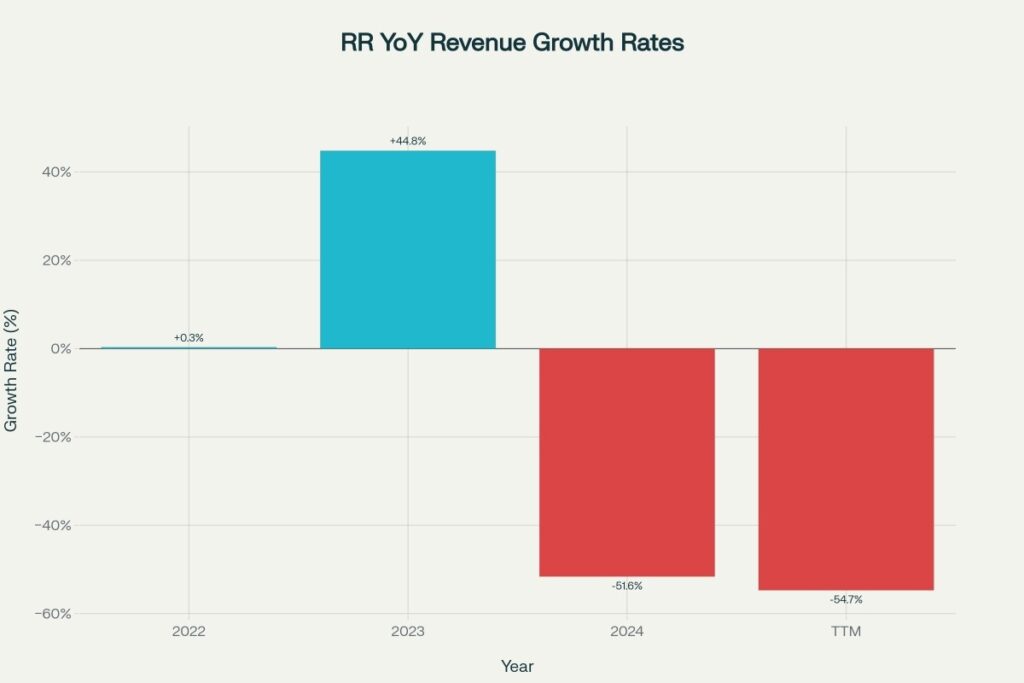
YoY growth profile
YoY revenue growth rates: 2022 ~+0.30%, 2023 ~+44.80%, 2024 ~−51.59%, TTM ~−54.71%, depicting a sharp post‑2023 slowdown.
Trading range context
The 52‑week low (~$0.5201), current (~$4.29), and 52‑week high (~$5.71) quantify the latest cycle’s range and mid‑range positioning as of the cited sources.
Forecast method overview
This article uses a simple scenario model seeded with current price to frame 2025–2030 targets: Average scenario assumes ~12% annual compounding, High scenario ~25%, and Low scenario ~−5%, chosen to bracket plausible outcomes given volatility and scale.
These are model outputs (not analyst targets), constrained by recent revenue trends and range context, and are meant for scenario planning rather than precise predictions.
Calculations (HTML only)
The model compounds annual scenarios from a current-price seed and linearly interpolates month paths around annual averages to keep monthly means equal to each year’s target.
Price Forecast Model
Inputs:
- Current price $$P_0$$ = 4.29
- Average scenario CAGR = 12%
- High scenario CAGR = 25%
- Low scenario CAGR = −5%
Annual projection:
P_year = P_0 × (1 + CAGR)^(year - 2024)
Monthly interpolation (keeps annual mean intact):
Let A_year = projected annual average price. Use multipliers M = [0.90,0.92,0.94,0.96,0.98,1.00,1.02,1.04,1.06,1.08,1.10,1.00], which sum to 12.00. Monthly price (Avg) = A_year × M_month.
Percent change vs current:
%Δ = ((Target - P_0) / P_0) × 100
Annual price scenarios (2025–2030)
Below are model-based annual averages (Avg), with High and Low scenario brackets, derived from the calculation above.
| Year | Avg (USD) | High (USD) | Low (USD) |
| 2025 | 4.80 | 5.36 | 4.08 |
| 2026 | 5.38 | 6.70 | 3.87 |
| 2027 | 6.02 | 8.37 | 3.68 |
| 2028 | 6.74 | 10.46 | 3.50 |
| 2029 | 7.55 | 13.08 | 3.32 |
| 2030 | 8.46 | 16.35 | 3.16 |
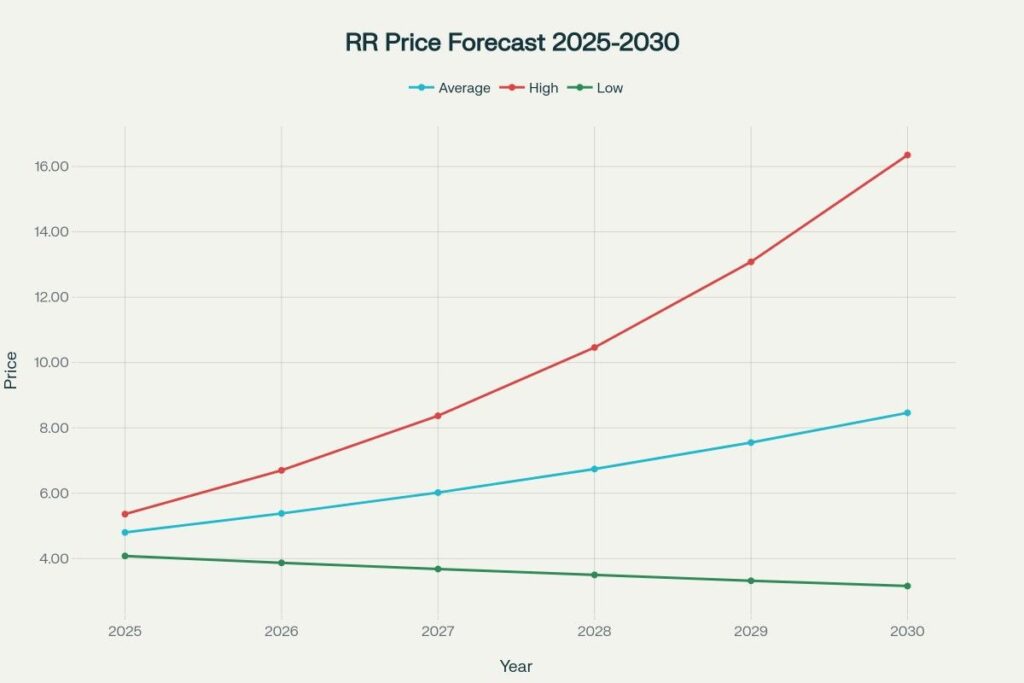
Forecast scenarios chart
The forecast chart shows the average, high, and low scenario paths from 2025 to 2030, seeded at the current price and compounded by the stated CAGRs.
Month-by-month “rate” table (2025–2030, Avg scenario)
Monthly rates are linearly distributed around each year’s Avg so that the 12 monthly values average to the model’s annual target.
| Year | Jan | Feb | Mar | Apr | May | Jun | Jul | Aug | Sep | Oct | Nov | Dec |
| 2025 | 4.32 | 4.42 | 4.51 | 4.61 | 4.70 | 4.80 | 4.90 | 4.99 | 5.09 | 5.18 | 5.28 | 4.80 |
| 2026 | 4.84 | 4.95 | 5.06 | 5.17 | 5.28 | 5.38 | 5.49 | 5.59 | 5.70 | 5.81 | 5.92 | 5.38 |
| 2027 | 5.42 | 5.54 | 5.66 | 5.78 | 5.90 | 6.02 | 6.14 | 6.26 | 6.38 | 6.50 | 6.62 | 6.02 |
| 2028 | 6.07 | 6.20 | 6.33 | 6.47 | 6.61 | 6.74 | 6.87 | 7.01 | 7.14 | 7.28 | 7.41 | 6.74 |
| 2029 | 6.80 | 6.95 | 7.09 | 7.25 | 7.40 | 7.55 | 7.70 | 7.85 | 8.00 | 8.16 | 8.30 | 7.55 |
| 2030 | 7.61 | 7.79 | 7.96 | 8.14 | 8.29 | 8.46 | 8.63 | 8.80 | 8.97 | 9.14 | 9.31 | 8.46 |
Interpreting growth and downfall across years and months
The revenue contraction from FY2023 to FY2024 explains why Low scenarios remain plausible despite strong rallies, as thin fundamentals can retrace during risk‑off phases. The month‑level path demonstrates gradual within‑year drift around annual averages, acknowledging that micro-cap moves are typically stepwise rather than smooth.
Additional valuation and profitability notes
Gross profit (TTM) of ~$3.14M contrasted with operating expenses near ~$19.45M underscores why profitability inflection is the gating item for a sustained re‑rate. Ownership concentration and low institutional presence suggest flows can exacerbate both rallies and declines, reinforcing wide uncertainty bands in scenario paths.
Disclaimer
These projections are illustrative, model‑based scenarios anchored to public price and revenue data and are not investment advice or guarantees of future performance. Trading in micro‑cap equities involves substantial risk, including potential loss of principal, illiquidity, and extreme volatility; conduct independent research and consider consulting a qualified financial advisor.