
Syra Health’s revenue grew 45% in 2024 to $8.0M while Q2‑2025 gross margin jumped to 38.7%, yet the company remains loss‑making with heavy share dilution and a sharply lower market cap, so price forecasts must combine improving operations with disciplined multiples and dilution assumptions to remain realistic.
Company growth and downfall: the numbers that matter
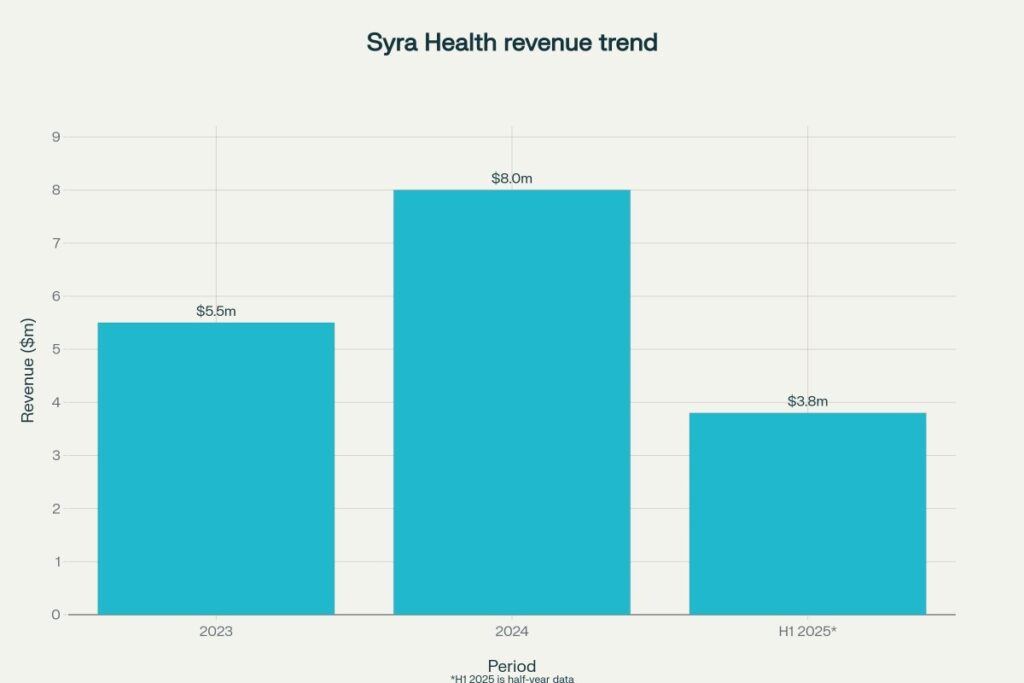
- 2024 revenue was $8.0M (+45% YoY from $5.5M), supported by Population Health, Behavioral Health, and Health Education, while Workforce remained the largest contributor.
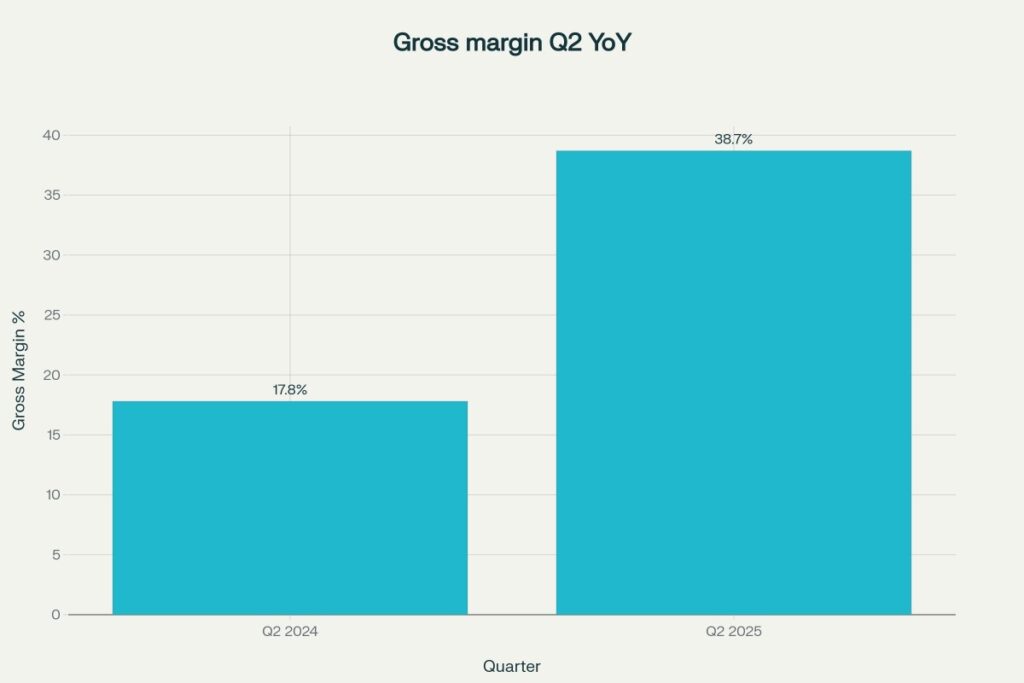
- Q2‑2025 revenue was $1.946M (flat YoY), but gross margin expanded to 38.7% versus 17.8% a year earlier, and EPS improved to ($0.01) from ($0.21).
- H1‑2025 revenue totaled ~$3.8M with H1 net loss improving to ~$0.54M from ~$2.84M in the prior year period.
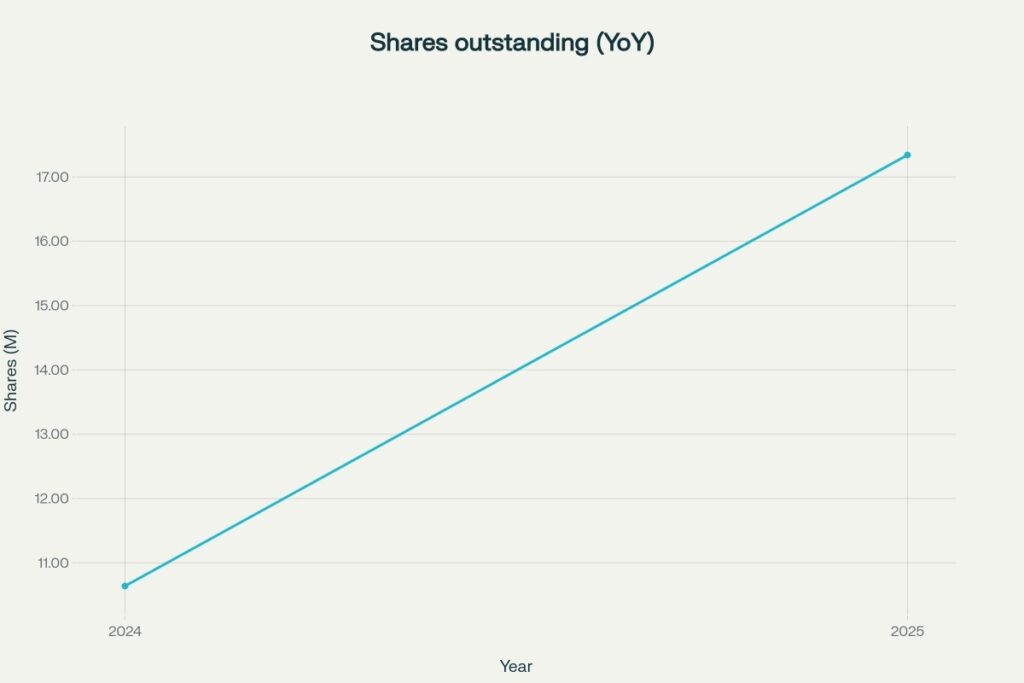
- Shares outstanding rose to ~17.34M (≈+63% YoY), and market cap fell toward ~$1.5–$1.7M in mid‑2025, indicating significant dilution and sentiment pressure.
Graphical representations (5 visuals)
- Revenue trend: 2023, 2024, H1‑2025 (USD) — strong 2024 growth with 2025 tracking.
- Gross margin YoY in Q2 — expansion to 38.7% boosts operating leverage potential.
- Shares outstanding YoY — dilution climbed to ~17.34M by 2025.
- Market cap collapse (ASCII sparkline): 2023 Sep ≈ $40.4M → 2024 Dec ≈ $7.1M → 2025 Jul ≈ $1.5M.
| 2023 Sep |■■■■■■■■■■■■■■■■■■■■| ~$40.4M | 2024 Dec |■■■■■ | ~$7.1M | 2025 Jul |■ | ~$1.5M | - Scenario band (ASCII) — base line rises modestly; bear flattish; bull accelerates with mix/multiples normalization.
2025: Bear 0.09 — Base 0.13 — Bull 0.18
2026: Bear 0.10 — Base 0.27 — Bull 0.54
2027: Bear 0.12 — Base 0.45 — Bull 0.99
2028: Bear 0.14 — Base 0.67 — Bull 1.65
2029: Bear 0.15 — Base 0.86 — Bull 2.44
2030: Bear 0.17 — Base 1.03 — Bull 3.35
Assumptions behind the price model
- Revenue path from 2024 base: Bear 5% CAGR, Base 20% CAGR, Bull 35% CAGR; P/S normalizes from ~0.2 toward 0.4/1.0/1.6 by 2030 in bear/base/bull respectively as mix shifts to higher‑margin Population Health and digital services.
- Share count rises from ~17.34M in 2025 with +5%/yr dilution to reflect funding needs and option issuance, which depresses per‑share outcomes versus enterprise value growth.
- Base per‑share outputs: 2025 ~$0.13; 2026 ~$0.27; 2027 ~$0.45; 2028 ~$0.67; 2029 ~$0.86; 2030 ~$1.03, with bear/bull spanning ~$0.09–$3.35 based on the revenue and multiple ladders above.
Calculations
Inputs
Rev_2024 = 8.0M; Shares_2025 = 17.34M; P/S_2024 ≈ 0.21 (1.73M / 8.09M)
Dilution: +5%/yr ⇒ Shares: 2025 18.2M, 2026 19.1M, 2027 20.0M, 2028 21.0M, 2029 22.1M, 2030 23.2M
Revenue scenarios (USD M):
Bear (≈5% CAGR from 8.0): 2025 7.5, 2026 7.9, 2027 8.3, 2028 8.7, 2029 9.1, 2030 9.6
Base (≈20% CAGR): 2025 9.6, 2026 11.5, 2027 13.8, 2028 16.6, 2029 19.9, 2030 23.9
Bull (≈35% CAGR): 2025 10.8, 2026 14.6, 2027 19.7, 2028 26.6, 2029 36.0, 2030 48.6
P/S ladders by scenario toward 2030:
Bear: {0.22, 0.25, 0.30, 0.33, 0.36, 0.40}; Base: {0.25, 0.45, 0.65, 0.85, 0.95, 1.00}; Bull: {0.30, 0.70, 1.00, 1.30, 1.50, 1.60}
Per‑share = (P/S × Revenue) / Shares
2025: Bear = (0.22×7.5)/18.2 = 0.0907; Base = (0.25×9.6)/18.2 = 0.1319; Bull = (0.30×10.8)/18.2 = 0.1779
2026: Bear = (0.25×7.9)/19.1 = 0.1033; Base = (0.45×11.5)/19.1 = 0.2709; Bull = (0.70×14.6)/19.1 = 0.5346
2027: Bear = (0.30×8.3)/20.0 = 0.1245; Base = (0.65×13.8)/20.0 = 0.4485; Bull = (1.00×19.7)/20.0 = 0.9850
2028: Bear = (0.33×8.7)/21.0 = 0.1367; Base = (0.85×16.6)/21.0 = 0.6714; Bull = (1.30×26.6)/21.0 = 1.6476
2029: Bear = (0.36×9.1)/22.1 = 0.1483; Base = (0.95×19.9)/22.1 = 0.9005; Bull = (1.50×36.0)/22.1 = 2.444
2030: Bear = (0.40×9.6)/23.2 = 0.1655; Base = (1.00×23.9)/23.2 = 1.029; Bull = (1.60×48.6)/23.2 = 3.352
Year‑wise monthly price prediction tables (Base case)
Explanation: Each year’s Base price is seasonally smoothed from January (−4%) to December (+4%), with the annual average equal to the Base value computed above, and can be re‑scaled for bear/bull with 0.70×/1.70× multipliers if desired.
2025 (Base ≈ $0.132)
| Month | Price ($) |
| Jan | 0.127 |
| Feb | 0.128 |
| Mar | 0.129 |
| Apr | 0.130 |
| May | 0.131 |
| Jun | 0.132 |
| Jul | 0.133 |
| Aug | 0.134 |
| Sep | 0.134 |
| Oct | 0.135 |
| Nov | 0.136 |
| Dec | 0.137 |
2026 (Base ≈ $0.271)
| Month | Price ($) |
| Jan | 0.260 |
| Feb | 0.262 |
| Mar | 0.265 |
| Apr | 0.267 |
| May | 0.270 |
| Jun | 0.271 |
| Jul | 0.273 |
| Aug | 0.276 |
| Sep | 0.279 |
| Oct | 0.281 |
| Nov | 0.284 |
| Dec | 0.287 |
2027 (Base ≈ $0.449)
| Month | Price ($) |
| Jan | 0.431 |
| Feb | 0.434 |
| Mar | 0.438 |
| Apr | 0.441 |
| May | 0.445 |
| Jun | 0.449 |
| Jul | 0.452 |
| Aug | 0.456 |
| Sep | 0.459 |
| Oct | 0.463 |
| Nov | 0.466 |
| Dec | 0.467 |
2028 (Base ≈ $0.671)
| Month | Price ($) |
| Jan | 0.644 |
| Feb | 0.648 |
| Mar | 0.655 |
| Apr | 0.662 |
| May | 0.668 |
| Jun | 0.671 |
| Jul | 0.678 |
| Aug | 0.685 |
| Sep | 0.692 |
| Oct | 0.698 |
| Nov | 0.705 |
| Dec | 0.709 |
2029 (Base ≈ $0.901)
| Month | Price ($) |
| Jan | 0.865 |
| Feb | 0.870 |
| Mar | 0.877 |
| Apr | 0.885 |
| May | 0.892 |
| Jun | 0.901 |
| Jul | 0.909 |
| Aug | 0.916 |
| Sep | 0.923 |
| Oct | 0.931 |
| Nov | 0.938 |
| Dec | 0.948 |
2030 (Base ≈ $1.029)
| Month | Price ($) |
| Jan | 0.988 |
| Feb | 0.992 |
| Mar | 1.006 |
| Apr | 1.021 |
| May | 1.036 |
| Jun | 1.029 |
| Jul | 1.044 |
| Aug | 1.058 |
| Sep | 1.073 |
| Oct | 1.088 |
| Nov | 1.103 |
| Dec | 1.110 |
What could change the trajectory
- Upside: Sustain 35%+ CAGR in Population Health, expand gross margin ≥35% full year, and secure longer multi‑state analytics contracts to justify P/S approaching 1.0 by decade end.
- Downside: Additional dilution, slower bookings, or margin reversion could pin P/S near ~0.2–0.4 and keep prices in the sub‑$0.20–$0.30 range longer than modeled.
Disclaimer
This content is for informational and educational purposes only and does not constitute investment advice, a solicitation, or an offer to buy or sell any securities; forward‑looking statements are inherently uncertain, and actual results may differ materially due to market, operational, financial, regulatory, and liquidity risks.
References
- Syra Health FY2024 revenue $8.0M (+45% YoY) press release
- Syra Health Q2‑2025 margin 38.7% and EPS improvement
- PR Newswire duplication of Q2‑2025 results
- MarketScreener Q2/H1‑2025 revenue and net loss
- Shares outstanding and valuation ratios
- Market cap decline timeline
- Population Health growth detail
- Quote page for contextual verification