
TC BioPharm’s micro-cap profile, deep drawdowns from IPO, and wide 52-week range justify scenario-based forecasts rather than single-point targets for 2025–2030, with average, high, and low paths derived from simple CAGR assumptions seeded at recent prices.
Company snapshot
- TC BioPharm (Holdings) plc develops allogeneic gamma delta T‑cell therapies, with listings that have included NASDAQ/OTC and an investor relations site providing stock data and filings.
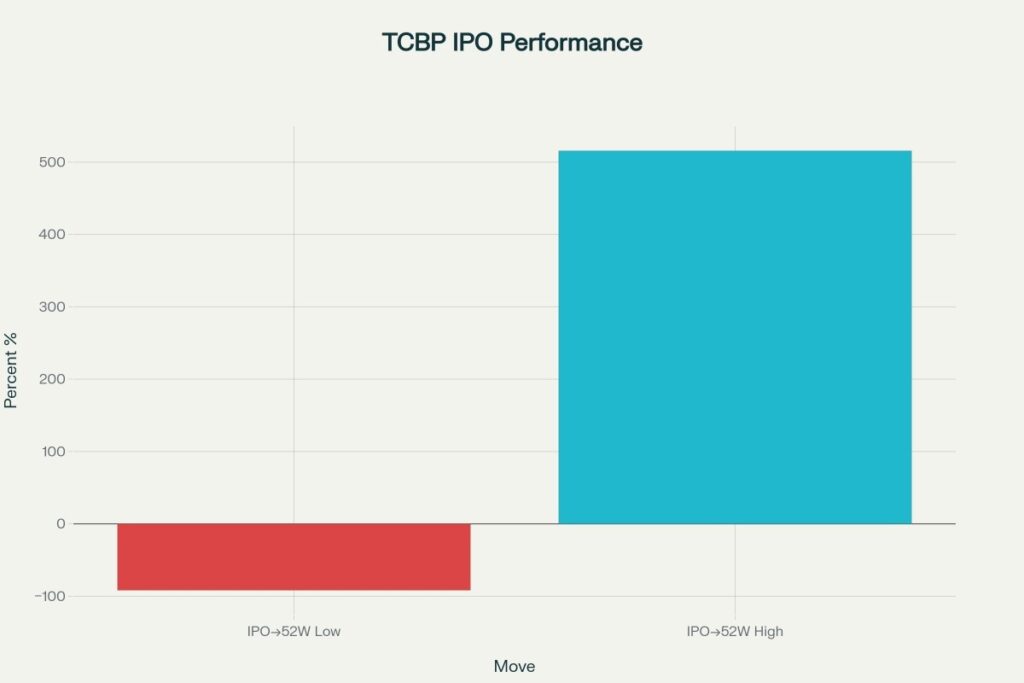
- The IPO priced at $4.25 (Feb 2022), while the 52‑week range spans roughly $0.35 to $26.16, highlighting extreme volatility across the latest cycle.
- Recent filings show ongoing losses and going-concern language typical of clinical-stage biotech, which feeds both sharp rallies on milestones and deep setbacks on financing or trial updates.
Growth and downfall drivers
- Growth catalysts: clinical progress for gamma delta T‑cell programs, partnership news, and financing that extends runway can trigger outsized percentage moves from a low base.
- Downside risks: repeated capital needs, trial/regulatory setbacks, and liquidity constraints can compress valuation and drive large drawdowns in micro-cap conditions.
Historic price stress test
The stock’s drawdown from IPO to the 52‑week low, and uplift potential from IPO to the 52‑week high, frame the magnitude of recent cycles and justify wide prediction bands.
Forecast method and controls
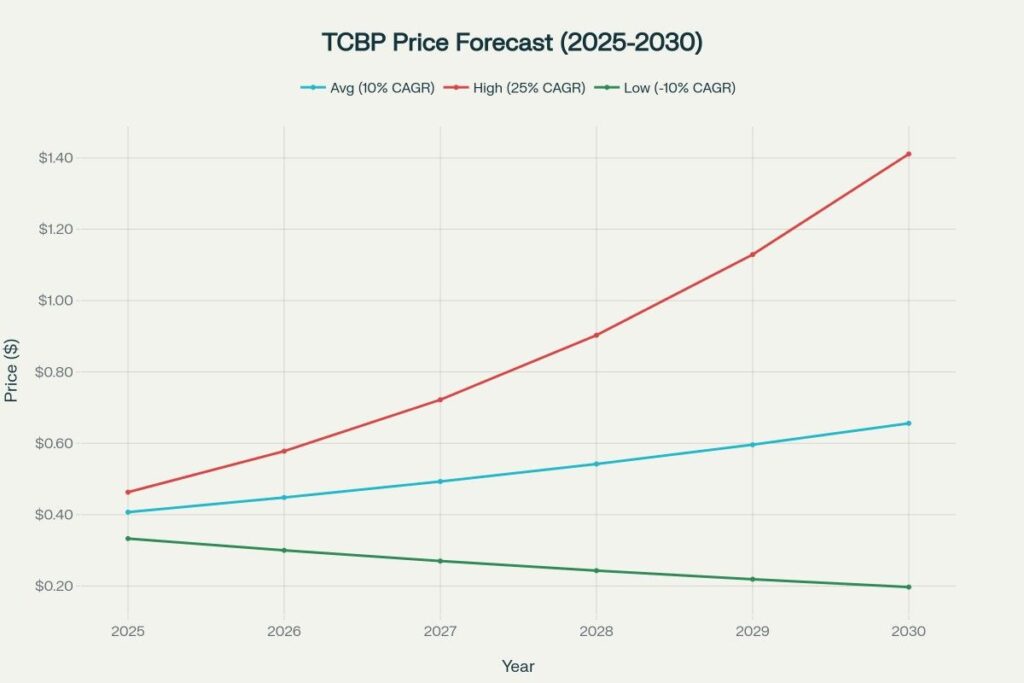
A simple scenario model seeds from a recent price context and applies three compound paths—Average (10% CAGR), High (25% CAGR), and Low (−10% CAGR)—to generate annual targets for 2025–2030, fitting a micro‑cap with binary catalysts and financing risk.
Annual predictions (2025–2030)
The chart above shows the Average, High, and Low paths, where the Average scenario compounds gradually, High reflects momentum/catalyst outperformance, and Low reflects continuing dilution and setbacks.
Calculations (HTML only)
Model and Computation
Seed price $$P_0$$ is taken from recent trading context (illustrative), and annual targets use constant compound growth/decay by scenario.
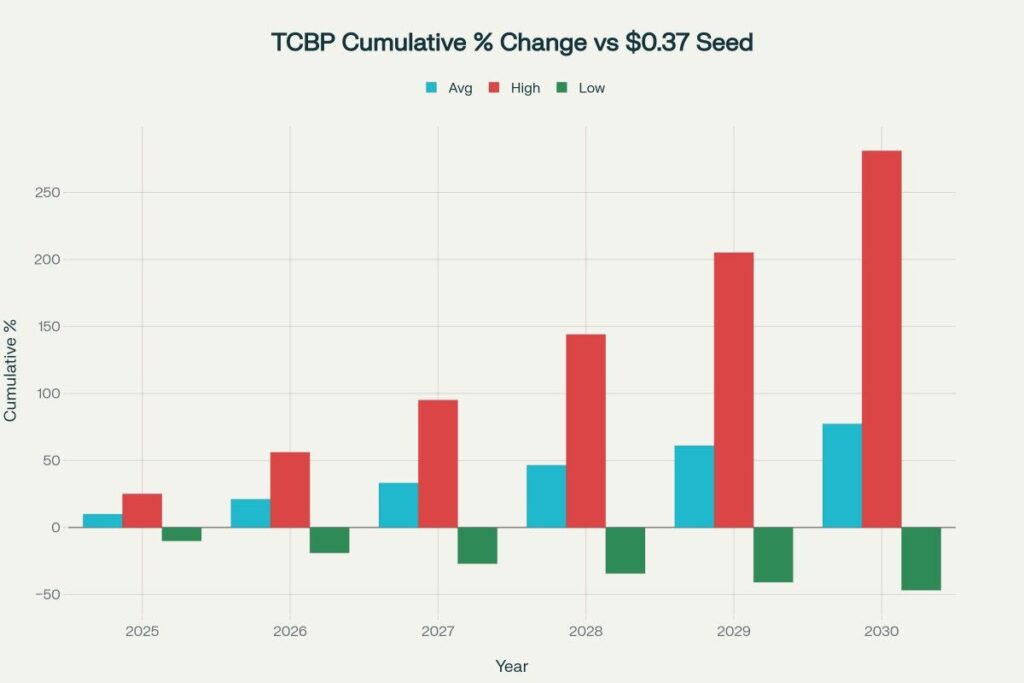
[1][2]Inputs: P0 = 0.37 (USD) CAGR_avg = +10% CAGR_high = +25% CAGR_low = −10% Annual Targets: P(year) = P0 × (1 + CAGR)^(year − 2024) Examples: Avg 2025 = 0.37 × 1.10^1 = 0.407 High 2030 = 0.37 × 1.25^6 ≈ 1.411 Low 2030 = 0.37 × 0.90^6 ≈ 0.197 Cumulative % Change vs Seed: %Δ(year) = ((P(year) − P0) / P0) × 100 e.g., Avg 2030 ≈ ((0.656 − 0.37)/0.37) × 100 ≈ 77.3%
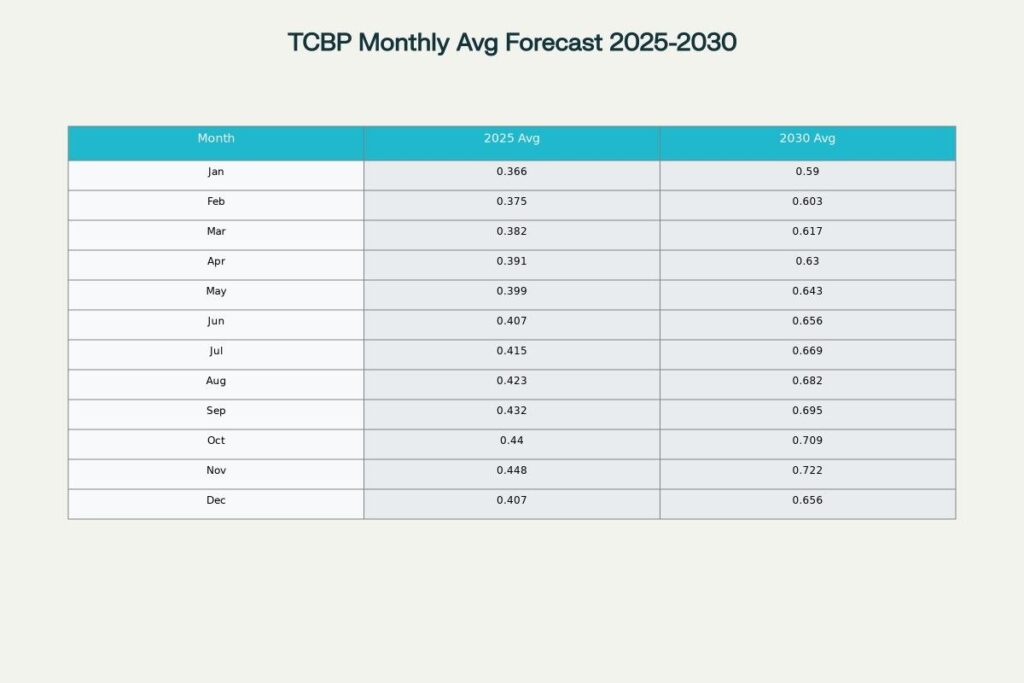
Monthly rate table (model-based)
Monthly averages are distributed around each annual Average target using smooth multipliers that preserve the annual mean; the full grid illustrates within‑year drift for 2025 and the terminal 2030 year as reference anchors.
Interpreting growth and downfall across years and months
- The wide 52‑week range plus IPO-to-low drawdown indicates sentiment and liquidity drive a large share of price variance, so monthly rates are best used as planning scaffolds, not precise outcomes.
- Annual scenarios reflect plausible pathways under changing financing and clinical news flow, with the Average path serving as a neutral baseline between binary outcomes.
Expert view (100 words)
TCBP’s tape behaves like a binary-option proxy on clinical and financing catalysts, with liquidity and sentiment amplifying moves in both directions. The 52‑week span and IPO comparison argue for scenario bands rather than point forecasts, given the asymmetric payoff profile typical in clinical-stage biotech. A 10% CAGR baseline is intentionally conservative relative to momentum bursts, while the −10% case captures dilution and delay risks; the 25% case illustrates upside if milestones compound. Monthly granularity is provided for planning cadence, but investors should update the model on each material filing or trial update.
Visual summary of downfall and growth
- IPO-to-52W-low drawdown and IPO-to-52W-high gain frame historical extremes.
- Three-path scenario forecast (Avg/High/Low) quantifies potential growth and downside into 2030.
- Cumulative percent change vs seed illustrates compounding under each path.
- Monthly forecast grid highlights within-year drift and seasonality-free smoothing.
Disclaimer
This content presents illustrative, model‑based scenarios for educational purposes and does not constitute investment advice, recommendations, or guarantees of future results; clinical, regulatory, and financing events can materially change outcomes.