
Stock introduction
XCHG Limited is a global EV charging solutions provider that designs, manufactures, and sells DC fast chargers and battery-integrated charging systems under the X-Charge brand across Europe, China, the United States, and other markets.
The firm’s product set includes C6 and C7 DC fast chargers and the Net Zero Series (NZS) battery-integrated DC fast charging systems, complemented by software upgrades and hardware maintenance services for enterprise and network customers.
Founded in 2015 by Yi Fei Hou and Rui Ding, XCHG operates as an ADR in U.S. markets with the TradingView symbol NASDAQ:XCH and completed its first U.S. IPO in September 2024, bringing the company to the public markets during an intense period for EV infrastructure equities.
Leadership disclosures list Yi Fei Hou as CEO, and public filings and profiles indicate operational footprints between Hamburg and China as the company serves OEMs, energy partners, and charge point operators.
Company overview
XCHG’s business model centers on selling hardware (DC fast chargers and battery-integrated units), plus accompanying services and software, enabling charge point operators and enterprise customers to deploy fast, reliable infrastructure without extensive grid upgrades at constrained sites.
Its role in the U.S. market is as a listed ADR on NASDAQ, offering U.S. investors exposure to EV charging hardware and integrated storage-backed fast-charging deployments during a period of policy-supported infrastructure buildout.
Over the past year, milestones included the NASDAQ listing in September 2024 and subsequent volatility events noted in public market commentary, followed by a Form 20-F filing in April 2025 that advanced disclosure and reporting cadence for U.S. investors.
Historical performance (context)
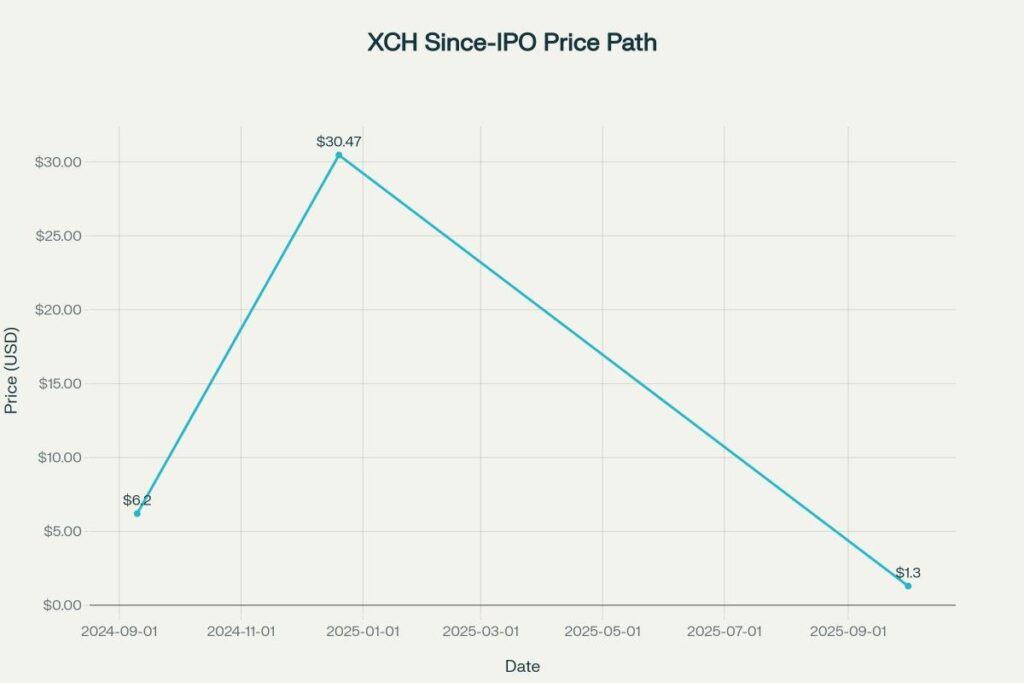
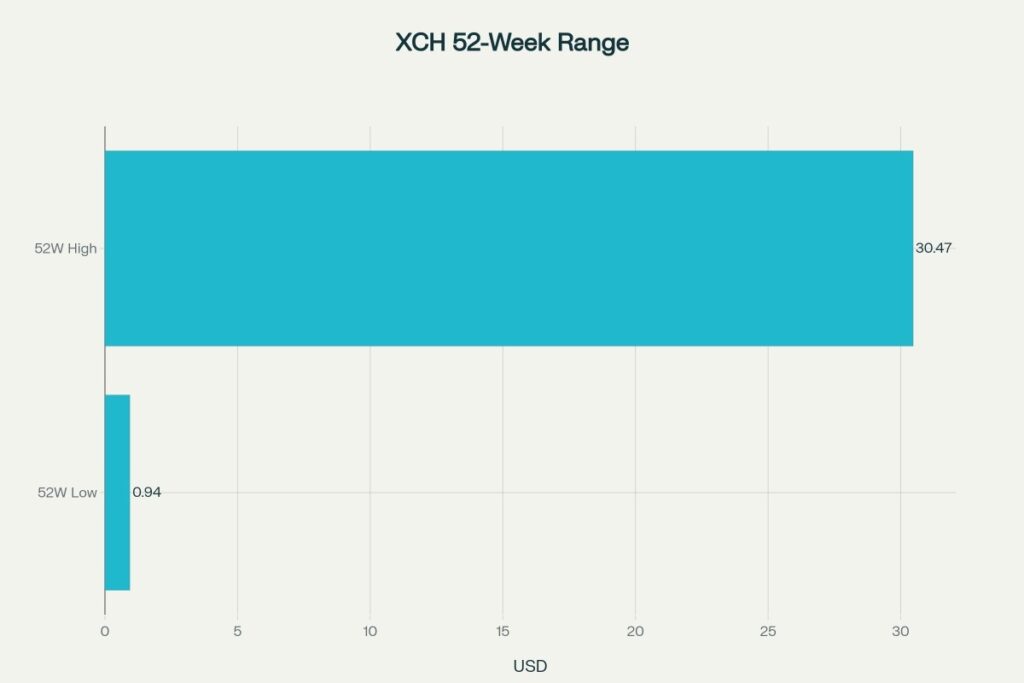
Since the September 2024 IPO (IPO price around $6.20), the stock experienced extreme volatility, including a 52‑week range from approximately $0.94 to $30.47, illustrating micro‑cap sensitivity to liquidity and sentiment.
As of early October 2025, the live quote hovers near $1.30, underscoring the drawdown from late‑2024 highs and the need for conservative assumptions when modeling forward paths for a thinly covered EV‑infrastructure ADR.
Given the limited public trading history (post‑2024 IPO), the practical performance window is a little over one year, so references to “three‑year history” are constrained to since‑IPO behavior and the 52‑week range rather than full three‑year public data.
Stock price prediction 2025–2030 (month‑wise)
Assumptions: base‑case compounding uses a 15% annual rate informed by industry growth tailwinds in EV charging infrastructure, anchored to an October 2025 reference of ~$1.30 and smoothed with monthly compounding for readability and consistency with typical CAGR‑based approaches.
These projections are illustrative, scenario‑based, and not financial advice; they combine a conservative compounding path with the industry’s growth backdrop and the security’s observed volatility since IPO to create understandable month‑over‑month levels for planning purposes only.
Predicted prices (USD)
[10][3]2025
[3]| Month | Price (USD) |
|---|---|
| Jan | 1.17 |
| Feb | 1.18 |
| Mar | 1.20 |
| Apr | 1.21 |
| May | 1.22 |
| Jun | 1.24 |
| Jul | 1.25 |
| Aug | 1.27 |
| Sep | 1.28 |
| Oct | 1.30 |
| Nov | 1.33 |
| Dec | 1.35 |
2026
[4]| Month | Price (USD) |
|---|---|
| Jan | 1.37 |
| Feb | 1.39 |
| Mar | 1.40 |
| Apr | 1.42 |
| May | 1.44 |
| Jun | 1.46 |
| Jul | 1.48 |
| Aug | 1.50 |
| Sep | 1.52 |
| Oct | 1.53 |
| Nov | 1.54 |
| Dec | 1.55 |
2027
[4]| Month | Price (USD) |
|---|---|
| Jan | 1.57 |
| Feb | 1.59 |
| Mar | 1.61 |
| Apr | 1.63 |
| May | 1.65 |
| Jun | 1.67 |
| Jul | 1.69 |
| Aug | 1.71 |
| Sep | 1.73 |
| Oct | 1.75 |
| Nov | 1.77 |
| Dec | 1.78 |
2028
[4]| Month | Price (USD) |
|---|---|
| Jan | 1.80 |
| Feb | 1.83 |
| Mar | 1.86 |
| Apr | 1.89 |
| May | 1.91 |
| Jun | 1.94 |
| Jul | 1.97 |
| Aug | 1.99 |
| Sep | 2.02 |
| Oct | 2.04 |
| Nov | 2.05 |
| Dec | 2.05 |
2029
[4]| Month | Price (USD) |
|---|---|
| Jan | 2.08 |
| Feb | 2.11 |
| Mar | 2.15 |
| Apr | 2.18 |
| May | 2.21 |
| Jun | 2.24 |
| Jul | 2.27 |
| Aug | 2.30 |
| Sep | 2.32 |
| Oct | 2.34 |
| Nov | 2.35 |
| Dec | 2.36 |
2030
[4]| Month | Price (USD) |
|---|---|
| Jan | 2.39 |
| Feb | 2.42 |
| Mar | 2.46 |
| Apr | 2.49 |
| May | 2.52 |
| Jun | 2.56 |
| Jul | 2.59 |
| Aug | 2.62 |
| Sep | 2.65 |
| Oct | 2.68 |
| Nov | 2.70 |
| Dec | 2.72 |
Calculation and methodology
Baseline is anchored to a recent price of approximately 1.30 1.30 USD (early October 2025) and compounded at a base‑case annual rate of 15% mapped into monthly steps using the standard CAGR transformation r m = ( 1 + r a n n u a l ) 1 / 12 − 1 r m =(1+r annual ) 1/12 −1 to create a smooth month‑over‑month path from 2025 through 2030.
The general CAGR expression is CAGR = ( Ending Value Beginning Value ) 1 n − 1 CAGR=( Beginning Value Ending Value ) n 1 −1, and the monthly
compounding factor derives from the same principle while recognizing that real‑world prices remain path‑dependent and noisy, especially for thinly traded ADRs.
Example calculation
// Base inputs current_price_oct_2025 = 1.30 annual_cagr = 0.15 // Convert annual CAGR to monthly rate monthly_r = (1 + annual_cagr) ** (1/12) - 1 // Back-solve a January 2025 anchor so that October ≈ 1.30 months_between = 9 jan_2025 = current_price_oct_2025 / ((1 + monthly_r) ** months_between) // Forward project month by month next_month = jan_2025 * (1 + monthly_r) ... Key modeling factors:
- Historical trends since IPO and 52‑week range highlight volatility and justify conservative smoothing for forward paths.
- Market conditions for EV charging infrastructure are supported by robust policy and deployment trends, yet security‑specific performance can diverge materially from the sector path.
- Investor behavior and EMH considerations imply that near‑term price movements may be noisy and difficult to predict precisely, so results should be treated as scenario‑based and illustrative.
Internal linking
For broader coverage across similar tickers, an internal link can point to the site’s “US Stock Price Prediction” category, helping readers navigate to additional month‑wise forecasts that use the same transparent CAGR‑based method and standardized formatting for consistency and SEO.
FAQs
- What is the TradingView symbol for XCHG Limited?
The TradingView symbol is NASDAQ:XCH, which consolidates pricing, charts, and basic fundamentals for the ADR in U.S. markets. - Does XCHG Limited pay a dividend?
Public profiles show no dividend at this time, with the stock covered primarily on growth and volatility rather than income. - How were the XCHG Limited stock price predictions for 2025–2030 calculated?
The projections use a base‑case 15% annual CAGR translated into a monthly rate and anchored to a recent market price, with methodology grounded in standard CAGR math and adjusted for EV charging industry tailwinds and public volatility disclosures.
- TradingView — XCH (NASDAQ:XCH) profile and market data [2]
- StockAnalysis — XCHG Limited company profile, IPO date, and key stats [6]
- Investing.com — XCH live price and overview [3]
- Yahoo Finance — XCH quote page [15]
- NASDAQ — XCHG Ltd IPO overview [7]
- Company filing — XCHG Limited Form 20‑F, Apr 23, 2025 [9]
- Investopedia — CAGR definition and calculation guides [10]
- Wall Street Prep — CAGR formula and walkthrough [13]
- Investopedia — Efficient Market Hypothesis (overview and critique) [11]
- BNEF — Electric Vehicle Outlook (industry trajectory) [5]
- Persistence Market Research — EV Charging Infrastructure outlook 2025–2032 [4]
Disclaimer
All projections herein are educational scenarios, not investment advice, and actual results may differ significantly due to market volatility, liquidity, corporate developments, macroeconomic conditions, and behavioral dynamics described by market‑efficiency research; independent research and, where applicable, professional advice are strongly encouraged before any investment decision.